| Submission Procedure |
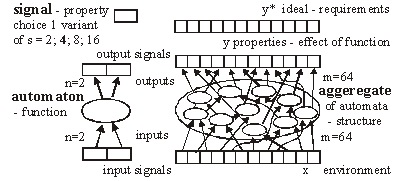
Structural Tendencies in Complex Systems Development and their Implication for Software SystemsAndrzej Gecow Mariusz Nowostawski Martin Purvis Abstract: Contemporary distributed software systems, exposed to highly unpredictable environments, are reaching extremely high complexity levels. For example, open heterogeneous multi-agent systems that may potentially be spread all around the globe are interacting with different types of dynamically changing web-services and web-technologies. Traditional control-based handling of adaptability may not be suitable anymore in such systems. Therefore there is a tendency for exploring different adaptability models inspired by biological phenomena. Biological systems inherently are faced with complexity and unpredictable environments, and they exhibit high levels of adaptability. In this article, we present a theoretical model of development of complex system, which was built originally by Andrzej Gecow, as a computational model in evolutionary biology. This model represents a generic complex system subjected to long sequences of adaptive changes. The model was used for analysis of development processes and also structural tendencies. By tendencies we mean some phenomena that should be expected in any complex system, subjected to a long development process. Some of these tendencies are not desirable, for example bloat of the system. Some of the phenomena, however, show characteristics of changes that improve the system. These characteristics can be applied to optimisation of self-producing and self-adapting algorithms of self-maintaining complex software systems. The main structural tendencies described in this article are: terminal modifications, terminal majority of additions, and covering (reconstructing within the system itself disappearing environmental signals). Keywords: complex systems, adaptable architectures, software life cycle Categories: H.1.1, C.1.3, D.2, K.4.m, G.m 1 IntroductionIn plain English adaptation is the act of changing something to make it suitable for a new purpose or situation. In software systems, the term adaptation is used mostly, if not exclusively, with the second semantic meaning. What is usually meant by software adaptation is that the system will continue to fulfil its original and the same purpose in a different set of circumstances, situation or environment. The adaptability in such software systems may be achieved by a set of feedback loops between the system, the controller monitoring and changing and adapting the system, and the environment itself. Page 327 The system purpose is pre-defined in advance as a set of specifications, which are kept within the controller. The behaviour of the system is automatically altered if the expected outputs are outside of these pre-defined specifications. Such models are built analogously to a way automatic control systems work [Kokar 99]. Most of them are based on top-down design and work well in limited environments, where changes in environment can be predicted and constrained in advance [Meng 00]. Such adaptive systems are tuned to particular kinds and specific levels of change in the environment. 1.1 Traditional Methods of AdaptabilityMost of the adaptability in software systems is achieved via control mechanism, as in automatics. There is a central system, with set of sensors and actuators, a controller, and an environment. Sensors sense an environment, the system and controller can be connected via a set of feedback loops, and the controller tries to keep the system within pre-defined boundaries. This model is be easily implemented; however it is static and must be applied in situations where we can predict in advance all the changes and variations in the environment. To make things more robust and flexible, we could implement into the controller an ability to learn, so the rules of changing the system become more dynamic, therefore the whole ensemble can follow changes in more dynamic environments. Yet it still suffers from some of the drawbacks of the simple model. Although in a different scale, there is still usually a limit of environmental change the system can cope with, which is predefined within the learning mechanism itself. 1.2 New Requirements for Adaptive Systems and Biological InspirationsContemporary software systems, especially open multi-agent distributed systems (eg. [Purvis 00]) that may potentially be spread all around the globe, interacting with different changing web-services and web-technologies are exposed to much more demanding, dynamic and unpredictable environments and traditional handling of adaptability may not be sufficient anymore in these circumstances. To fully benefit from life-like adaptability in software systems, that (at least in theory) might match the levels of complexity of biological organism, we need a formal mathematical model of all the fundamental concepts like: life, organism, evolvability and adaptation. In this work we will use a formal deductive model of process of adaptation described in detail in [Gecow 86]. The major step in understanding the process of evolution in natural life was done by Darwin [Darwin 1859], who proposed mechanisms by which purposeful adaptive changes take place via processes of random mutation and natural selection. Darwinian mechanisms postulate reproduction, statistical character of change processes, and the process of elimination. After elimination the organism ceases to exist (is not alive anymore). The formal deductive model we are going to use is just based on these rudimentary Darwinian mechanisms, and adaptability in software is inspired by the mechanisms which handle purposefulness in natural life. In this work we use a theory of evolvable ensembles. Some of these ideas have been developed over the last three decades [Gecow 75, 83, 86], with the roots of the proposed model traceable to the work of John von Neumann [Neumann 63, 66]. Page 328 Von Neumann submitted that a precise mathematical definition must be given to basic biological theories. The work of von Neumann has been, most noticeably, pursued and extended by Gregory Chaitin [Chaitin 70, 79]. A slightly different approach in formalizing process of life has been pursued by others (e.g. [Eigen 79]). Similarly to von Neumann and Chaitin, our model is based on the discrete model universe, an automata space, with a finite number of states. Note however, that the formal definition of information, which is being used throughout this article, is defined in the context of a static collection of bits (as it was originally proposed in [Shannon, 49]) rather than an algorithmic settings (as in [Chaitin 79]). 1.3 Theoretical FoundationsThe model we discuss here can be applied to different software architectures. It is suited for object-oriented web technologies or multi-agent systems. It is not constrained however to these paradigms, and it can be easily implemented in any computing paradigm, for example the presented results were obtained on a simple computing model based on finite-state automata without memory. For the sake of uniformity we will use the term system to denote a coarse-grained unit of processing within a given computing framework. A system can be implemented within the object-oriented paradigm as an object; or it can be an individual agent from agent-oriented paradigm, etc. The important part is that the individual system is an ensemble of lower-level structures that can be manipulated at runtime. That is, the system can be disassembled into its individual components, and re-assembled again during the actual operation of the system. In other words a certain level of reflection is needed within a computing paradigm for the proposed model to be easily implemented. It is believed by some that the information-centric approach to theoretical biology is a correct (if not the only) possible path to pursue the research and make progress [Orgel 73, Chaitin 79]. We believe that using an information-centric approach with formal mathematical models can be more effective for research in the area of adaptability and evolvability of software systems than using pure control theory. 1.4 Research GoalsThe main aim of this work is to build a proper formal theoretical model to investigate a wide range of statistical tendencies in the evolution of a complex system. The presented model and obtained results represent a set of preliminary, yet useful, hints. We are looking for structural tendencies that may be useful when developing new methodologies and tools for a new generation adaptive software systems. The structural tendencies discussed here may identify specific change mechanisms that statistically increase the chances of improving the system (adapt it to new requirements). All automatic change generators for our adaptive system must have all the information necessary to optimally generate the changes to the system (generating hypothesis to be tested). One of the potential benefits for such an automatic change generator may be to exploit some of the statistical properties of a collection of interacting and interdependent entities. This is what we concentrate on in this article. Page 329 2 Foundations for the Model2.1 Intuitions and Semantics of Base TermsDifferent authors use terms like development, complexity, system, and complex systems with different semantic meaning. It is crucial for the reader to understand and maintain the semantic meaning of the technical terms used in this article according to the authors' intentions. Some vocabulary will have the semantics as used conventionally, but some other vocabulary will depart significantly from their colloquial semantics. In most of contemporary research, networks are modelled as graphs [Barabasi 03], or as directed graphs. Some use binary signals between nodes, as in case of Boolean and Random Boolean networks [Kauffman 93, Stauffer 96, Albert 00]. For us, a system is a directed network of interacting entities, and its description is composed of conditional relationships between these entities. The signals between the nodes are discrete, but not necessarily binary in nature. Complexity is a measure of the relative number of entities and interdependencies in a given system [Weisbuch 88]. As will be shown in later sections, a complex system is characterised by a set of qualitative differences from a system, and our aim is to identify these differences. One of the characteristics of a system is the notion of its function. The function is the mapping between system's inputs and its output. One can define a set of requirements on the system function. A system's function can be compared to a predefined ideal function. This measure of quality will indicate the degree to which the system's functional outputs match the ideal functional outputs for the same inputs - similar to that predefined ideal function (or the measure of requirements fulfilment). The measure of this similarity is called system's aptness. There are many possible different interpretations of the concept of "environment" and "system response to a given environment". In our simulations we provide the signals from the environment to the input of the system. These are interpreted as external conditions in which the system exists. We assume a constant environment. This is required by our modelling purposes. The requirements of the system are therefore reduced to a single output vector of the system. The system can be subjected to change. A change can be expressed as an alteration of the number of a system's entities, or only a modification in system's configuration (the network of interdependencies). Any change to the system may (and in most cases does) change the system's function. A process that changes a given system in a totally random fashion we will refer as a free process. Development is a conditional change subject to the non-decrease of the system's aptness. A process that develops the system, that adapts the system to the predefined ideal system's function, or adapts the system to the requirements, we will call: development, adaptive process, or adaptive evolution. 2.2 Basic AssumptionsAs it was introduced above, the system is treated primarily as a network of relationships created to fulfil a particular set of requirements. The system is tuned to the requirements by a process of change. There are three basic mechanisms that can alter the current configuration of a given system. There is a random change, equivalent to the free process introduced in [Section 2.1]. Page 330 There is an external constructor that controls the system and is capable of changing its configuration. And there are self-imposed (reflective) and self-maintaining processes within the system itself capable of altering its current configuration. In our model we assume that the random changes are truly random and can alter the system in many possible ways. The other two change mechanisms are characterized by the directional change, in a way that is not decreasing the system aptness. Therefore, any change of the system performed by the constructor or internal system's processes by definition must be equivalent to the development of the system. The adaptive evolution, i.e. development, as introduced in [Section 2.1], inherently means that the systems` aptness is not decreasing. Adaptive evolution of a system then consists of developmental stages, where the system is changing its configuration or structure without the aptness decrease. One can say that the system is being changed, or adaptively evolved, by its constructor or internal processes in order to increase its aptness. The improvement changes are the result of the following procedure: first, random changes to the system are conducted. This is similar to the free process. Then, the changes are tested for the aptness. If the change leads to the aptness increase, the change is accepted. If the change leads to the aptness decrease, the change is not accepted. This method is similar to other evolutionary algorithms, in a way that there is a selection procedure that accepts or rejects changes generated by a random process. For example see Genetic Algorithms [Vose 99], and Genetic Programming [Koza 92]. If requirements imposed on the system (the ideal system's function) or external conditions (system inputs) have changed, it is possible for the system's aptness to decrease. In fact, in most of the cases the aptness will decrease. We require the system to compensate for such aptness decrease and adapt to new requirements by changing itself in order to maintain its aptness level. In a relatively short time free processes will tend to decrease a system's aptness, and will lead to the system's disintegration. The probability distributions of different characteristics of developing systems differ substantially from free processes. In short this is exactly what we look for: differences between changes in a system caused by free vs. developmental process. By analysing these characteristic tendencies we can infer which changes of the system are more apt for system development and for maintaining its aptness. We will investigate the statistical differences between free and developmental process, and we will call these differences: tendencies. We have discovered two basic types of tendencies. These two types have different mechanisms of origin. The first one is based on the change propagation from change initiation point to outputs of the system. The second one is based on additions and removals of elements of a system, and the lack of balance between these two processes in different parts of the system. It is intuitively easy to understand that smaller changes of system output have more chance to be adaptive. The question is what kind of change initiation place should be used, and what the relation of this place to system structure is. To investigate this relationship, we obtained the statistical dependency of size of change of the system's outputs as a function of system aptness. Each single change of the system is like a step, (generation or iteration) in the development process. It is not a step typical to neural networks or cellular automata. We will refer to a single change as a single generation. Due to simplification, our model does not contain anything that would be equivalent to a step from these constructions. Page 331 A sequence of subsequent generations represents an evolution of the system. This is in analogy to the physical understanding of the term evolution of the system. Evolution of the system that does not decrease a system's aptness is referred as adaptive evolution, or development (as discussed above). From the fact that we are interested only in statistical tendencies of the observed process, we sometimes do not need to use an exact iteration count to observe a directional aspect of the process under investigation. In other words we do not need to use t (iteration count, or time of system evolution) as g (measure of progression of the process). Sometimes it is sufficient to use a statistically significant variable, to measure g, in order to infer the process direction. In a developing system, a stage with smaller aptness will always precede a stage with higher aptness. Therefore, we can use the aptness itself (variable b) as a measure of progression of the process (g), instead of an accurate iteration count. There are other possible variables that can be used as a measure of progression of the process, for example N, the number of trials to adaptively change the system. The reader should keep this point in mind during the following discussion when the variable g is referenced. 3 Simple Vector-based Model3.1 Representation of a SystemLet us assume that a system is represented by m entities, which will be modelled simply by properties. Each of the properties, signals, has a number of possible variants. We assume all the variants of a given signal to be of equal probability. We also assume that all signals have the same number s of variants. Let us represent variant values by an integer number from 0 to s-1. We then represent a system as a vector y: y = (y1, y2, ..., yi, ..., ym), where each value yi ? [0,s-1]. In our simulations the number s of variants of signal was s=2,4,8,16. To obtain a free process we simply modify the system in a random fashion. To obtain a development of the system, first we need to define an ideal system y*. In other words we need to provide an ideal vector y*. It represents our ideal system. Now after any modification, the system is compared to its ideal configuration and we obtain a parameter b - number of signals that match to the ideal state. b is a measure of similarity of y and its ideal y* and represents aptness of the system.
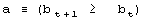
For development we require that b cannot decrease. This condition leads to development of a system that improves its aptness. The condition a is the adaptive condition, t is the iteration (change) counter. After each individual change to the system t is incremented by a fixed value 1. It is equivalent to a simulated time. 3.2 Definition of TendencyWe try to capture the differences and characteristics between adaptive and free processes. In particular, we try to estimate and analyse differences in a probability distribution between random changes in the system occurring without and with the improvement condition a. Page 332 This simple model presented above is enough to demonstrate one of the fundamental tendencies: small change tendency. Let X denotes a parameter of change for the system. P(X|a) denotes a probability of accepting the change with parameter X subject to adaptive condition a, and P(X) is the probability of unconditional change of the system with parameter X. P(a|X) denotes a probability of the adaptive change of the system for a given change parameter X. The probability distributions may change during the progression of the process; therefore we can generalize it to multiple generations, and we use the measure of progression of the process g to denote a current stage of the process. In the general case then, we have from Bayes:
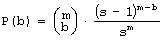
For a single generation, when g is constant, P(a|g) is also constant. We can calculate the tendency by the probability of acceptance change with parameter X: P(a|X). Or in a general case: P(a|X,g). It is important to note that one does not have to know actual distributions of P(X) or P(X|g) to estimate the tendency. It is enough that for different parameters X, that distribution P(a|X) differs. 3.3 Aptness in Free and Adaptive ProcessesDuring system evolution, thanks to adaptive condition bt+1=bt parameters b and t grow together (see right side of [Fig. 1]). If the ideal system y* is constant then the level of aptness, b, may be used in place of g (measure of system progression). It was described in [Section 2.2] that we can use the value of aptness itself as a measure of progression of the process, instead of a precise generation count. As we are interested only in the statistical effects of the process, this can simplify many of the experiments and calculations. In free processes, probability distribution of aptness b is given by Bernoulli's distribution:
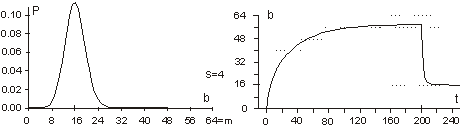
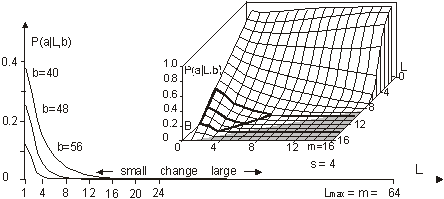
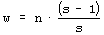
For s=4 and m=64 the aptness distribution is shown on the left side of [Fig. 1]. It has maximum at point b =m/s. Let L be a number of changed signals. We will call L a change size. To show the history of aptness, we must assume some fixed P(L) distribution. For a simple case, let each property of a system have a probability equal to 1/4 that it will be changed - it gives the same distribution as shown on the left side of [Fig. 1]. With such an assumption one can see (right side of [Fig. 1]) that average aptness in (function of generation) grows. Page 333 Figure 1: Probability of aptness b in free process and average aptness history in adaptive (t < 200) and free (t > 200) processes (for fixed P(L)) We calculated the probabilities for 200 generations, and after the 200-th change adaptive condition was removed. We started a free process of change instead. In a few steps aptness drops down and it achieved a level of maximum probability (shown on the left of [Fig. 1]). The departure from the maximum probability level and growing aptness of the system is a simple consequence of the adaptive condition, and as such it is a simple tendency. These effects are even more interesting when analysed from an entropy and information point of view [Gecow 86]. Figure 2: Small change tendency for higher aptness b in probability of acceptance. L - change size, m - number of signals (properties), s - number of signal variant. [Fig. 2] shows P(a|L,b) for s=4 and m=16 (in 3D graph) and m=64 with three highest b=40,48 and 56 (on 2D graph) that highlight the most interesting area. In 3D graph in the grey area on the bottom right side, the probability of acceptance P(a|L,b) equals zero. For the interesting upper values of b only very small L (change size) is acceptable with significant probability (hard drawn area). For m=64 this area is smaller. This is the small change tendency. If s grows, the size L of acceptable changes becomes even smaller. The small change tendency leads to other more useful structural tendencies. It creates also a natural identity criterion that has more philosophical implications and may be used for definitions of life processes. Page 334 4 Model of Automata Aggregate4.1 System StructureThe previously described model is very simple, and it is enough to demonstrate the small changes tendency. We will extend the previous model to show other tendencies of the developing system. Previously, however our system had only a vector of properties. It lacked any internal structure. Now we add a system structure in a form of aggregate of one state automata without memory. Automaton is the smallest part (entity, building block) of system. It is a node in a directed graph. It has a few inputs and outputs. In our simulations the number of inputs and outputs of automata in the network is set to 2, so each of our automata have, n=2 inputs and also n=2 outputs. This is the smallest value that we can assume for useful simulation. The system receives signals from environment x. These signals are transformed by a complex network (which represent the actual system structure) of interconnected automata into system output signals. This output signals are interpreted as properties of the system and we compare them to the ideal in order check the improvement condition a. This is similar to the previous model. This time outputs of the system (which means outputs of some of the finite state automata) are forming the vector y. We change the system by adding and removing automata to and from its interconnected network of automata. In this model the small change tendency results in a few other structural tendencies, and as such is useful for optimisation of system development mechanisms. Figure 3: Signal, automaton and aggregate of automata, and their elements (see text for details). All automata transform input signals into output signals. That is equivalent to performing a simple function. Note, that an automaton gets 2 independent input signals and after transformation it sends 2 usually different output signals, that then become inputs for other automata. Note, that in our model each automaton has two independent outputs. This is one of the differences between our model and Boolean Random networks [Kauffman 93, Stauffer 96, Albert 00], where all outputs of a single node are always the same (not independent). Page 335 Our network of automata grows randomly, and we enforce the aptness improvement condition (adaptive condition a). One input of automaton may be connected to only one output of one automaton and one output of an automaton can send a signal only to one automaton input. Free automata inputs (not connected from other automata) get signals from the environment and free automata outputs (not connected to other automata) are system's outputs. Such a network of automata we call an aggregate of automata. This is our model of system structure. This model was built and simulated before 1999 [Gecow 75, 83], when Albert-Laszlo Barabasi showed that most naturally occurring phenomena and systems have scale-free distribution of k-node degree [Barabasi 99]. Our aggregate of automata is a regular network because the number of links of each node is constant, fixed n=2 for output and input, i.e. the degree of node is precisely k=4. Taking into account the recent advances in the field, we are preparing a new simulation based on a scale-free network model [Barabasi 03]. The environment is constant (except covering experiments that will be discussed later in detail). The environment represents external conditions of system function and has a low relationship to requirements for system function (ideal system function). In this simple model we do not research quick system answer for an environmental stimulus - such an adequate answer is included in the requirements themselves. 4.2 Coefficient of Change PropagationIf one of the automaton input signals is changed, then it may cause this automaton output to be changed. This in turn will lead to other automata to receive different inputs and in turn produce different outputs, and so on. We are interested in how many output signals are changed, on average, after a single change in the input to a given single automaton. To answer this question we simply calculate it from the formula below.
Above, w is a coefficient of change propagation, s - the number of variants of signal; and n - the number of automaton outputs. Only for n=2, s=2, and not bijective functions, can we obtain w<1 and then change in network will fade out. In this case both parameters: n and s have absolute minimum values, and we should not expect this in real complex systems. In all other cases, the change on average will grow in an automata network. One of the important aspects of our model is the parameter s. In our model it is more important to have a uniform distribution of probability of each variant of a given signal than the actual number of signal variants. The difference in probabilities of occurrence of different variants is much more significant than the number of signal variants. In our model we assume that the probabilities of all variants are the same. Therefore, for modelling a single variant which can occur with probability, for example 1/8, we have to simulate it by having 8 variants, each with 1/8 probability. In that case 7 out of 8 signals will be treated as noise. In some situations where some probabilities are very small, it may result in a big number of signal variants. This is directly related to the information content of a signal. The bigger the information content, the larger number of signal variants. Page 336 If one draws the aggregate with each signal travelling between automata as arrows, one could traverse the network simply following the arrows. If one starts from the aggregate inputs, some automata would be visited earlier, and others would be visited later. However, with the feedback loops it is not feasible to define a global "earlier-later" relationship between all the aggregate's automata. In the general case, this relationship has only local character, we call it functional order. For network without feedbacks, we can draw an ideal "earlier-later" relationship, called cone of influence [Gecow 83]. Cone of influence is the functional dependency between a given automaton and the ones this automaton can influence by its outputs. A given automaton divides the system structure into three parts: earlier automata that influence the given automaton (in-components as used in [Dorogovtsev 03], and notion of supremacy [Holyst 04]), later automata (out-components) that will produce outputs depended on a given automaton and neutral automata that are independent, and do not influence a given automata. This is, as defined above, a functional order in the system structure derived from the signal propagation. A given automaton can change the outputs only of the following automata. However, the change does not need to fill all the parts of the cone of influence. The degree of fill depends on the coefficient of change propagation. In a given aggregate, where all automata have the same n and s, the coefficient w is constant. The size L of change on outputs of structure depends then only on height of the cone of influence. If we draw aggregate, as on the [Fig. 3] where signals go from bottom up and there are outputs in top of the structure, then this height of the cone would start at the top of the diagram, on the system outputs, and would continue downwards down to the point initialising the change. This is equivalent to the concept of depth of change source. Initiation of change in deeper parts of the system structure should cause a larger change of outputs, because it has larger cone of influence, covering more output signals. The small change tendency should prefer small depth. This is the main mechanism for structural tendencies. 4.3 Depth - the Measure of Functional OrderIn our models we have to assume systems with feedback loops, as they are more robust, flexible and more adequate to modelling development of software systems. Our aggregate will have then highly irregular structure, with feedback loops. Therefore the simple view of the cone of influence has only a demonstrative purpose. It is quite difficult to refer uniquely to a particular place in the growing structure of our aggregate. There are feedback loops, and the structure itself has a very irregular character; and there are only two points of reference: aggregate inputs and aggregate outputs. The problem of referring to particular automata in different aggregate structures is even more difficult because we need a mechanism to identify and refer to "similar" regions, in the general case, for different growing aggregate structures. We proposed two methods of referring to automata in an aggregate. In the first simple method we marked whether the added automaton was placed closer to the inputs, or closer to the outputs. We ran analysis based on this, and we called this model: edge model. This name represents the fact that all the additions were performed on the "edge of the aggregate": on the input, and/or on the output of the system. We have not used removals in this model. Page 337 The second method was based on calculating the depth of a given automata in reference to the aggregate outputs. This allowed us to perform additions and removals in the whole volume of the aggregate. We referred to this model as volume model. In this model, we used the depth as an approximation of the aggregate functional order. See [Fig. 8] for the definition used in our simulations. 4.4 Changeability4.4.1 System Change DistributionsWe know from Bayes condition (equation 2) that probability distributions of the main characteristics of changes in a free process should not be important to show statistical tendencies (differences between free and adaptive process). However, we can assume different probability distributions for different aspects of the aggregate development that result in differences in the aggregate structure. In aggregates that differ in structure, a given tendency may have a different level of expression. For example, we can expect that an aggregate that was grown only by the addition will be different from the aggregate grown with both addition and removal changes. This, in turn, will influence the tendencies that we are trying to investigate. The fundamental aspects of some tendencies are expressed as relationships of intensity of some events. For example, when investigating the aggregate tendency to grow, we have to analyse the difference between probabilities of acceptance between changes based on addition and on removal. One can see that it is very important to pick appropriate probability distributions to observe given tendencies. In our model these distributions however have an arbitrary character, and can be any. Based on the unknown character of most of these distributions, we use uniform probability distributions. It is important to remember that sometimes a given tendency influences the expression of the very tendency, or other tendencies (feedback loops). It is easy to implement the assumption of the uniform probability distribution of change in all of the aggregate volume. We implemented removals simply by a random selection of an automaton to be removed, from the list of all of the aggregate automata. After removing it we reconnect two of its inputs with two of its outputs directly. For additions we have to randomly generate a new automaton - we create its function (function between its inputs and outputs). Then we select two existing connections between automata (including inputs and outputs of the aggregate). We "break" the connections, and reconnect the newly created automaton with appropriate input and output connections. This is a different algorithm than assumed in random graph theory [Albert 02]. Also it differs substantially from the case of addition of a new node and directed edges [Dorogovtsev 00]. 4.4.2 Differences Between Addition and Removal of AutomataAs described above, there are some important differences between adding and removing automata to and from a system. The process of automaton removal has relatively fewer possibilities and is inherently simpler. This is an important source of difference in probabilities of change acceptance due to adaptive condition (changing the system without decreasing the system aptness). It is possible to run a test for removal of all individual automata of aggregate to check that nothing can be removed without decreasing the aptness. It is however impossible to do the same test for addition, simply because one can always add a new automata that will not change the system's aptness. Page 328 This simply means that by the properties of addition and removal, the system will grow in size indefinitely. After accepted aggregate change, the conditions for the next aggregate change may themselves change. For example if there is nothing that can be removed from the aggregate, then after a successful addition possible removals may naturally occur. 4.4.3 Transparent Automata and CostDue to our assumed adaptive condition (weak inequality) it is possible to always add transparent automata. Transparent automata are such automata that do not change the output signals for particular inputs. In other words, the output signals are exactly the same, with or without such automata. In simulations this is a very common event (to randomly select a transparent automaton to be added). These transparent automata, given different input signals, will produce appropriate output signals, according to their actual function. In that case these transparent automata are not transparent anymore. After addition, transparent automata may be kept in the structure, or may be subjected to automatic removal - because they do not do anything. The issue of transparent automata is similar to, but substantially different from, "neutral walk" models, e.g. [Gould 77]. Temporary useless structures and repetitions are kept in a "neutral walk" model until they prove to be useful. However, our model is too simple to accommodate a "neutral walk" model in its entirety. We do not model local optima of aptness, and the ability to jump from one to the other. For software systems if we take into consideration memory and CPU time, and other similar cost functions to maintain an automaton in the aggregate structure, then adding one more extra automaton is always considered as a decrease in the aptness of the aggregate. To make it simple, yet general, we used strict inequality in the adaptive condition for additions, and weak inequality for removals. This is equivalent to an explicit cost function for additions of new automaton. For big values of number of signal variants (s) the importance of this extra condition (cost function) is decreasing, due to the lower probability of random selections of transparent automata. 4.4.4 Change of RequirementsIn our model, to obtain a long adaptive process, the ideal y* must be slowly changed (the b for a system is kept at the level 3/4 of the ideal value of aptness). Without this change of requirements, the aptness b in a short time achieves maximum value and then any really adaptive change of the aggregate is prohibited. We are interested in long-term cumulative adaptive changes that substantially lead to increase of aptness. Traditionally, the term "environment" includes external conditions of existence of an organism (a system), together with the requirements imposed on the organism to exist. We have decoupled these two aspects. The requirements are separate (conditions on output signals) to the external conditions (input signals). In our simulations the environment of the aggregate was fixed. Only for investigating tendency of covering have we used a changing environment. Page 339 4.5 Calculating the Function of an Aggregate of AutomataTo do the calculation of the aggregate function, we use the description of the structure of aggregate (all the connections) and functions of individual automata. We will refer to it as: R-algorithm. We developed it in several steps. 4.5.1 Algorithm R0The aggregate structure itself in an obvious way suggests a simple algorithm for calculating aggregate outputs. We will call this simple algorithm, R0:
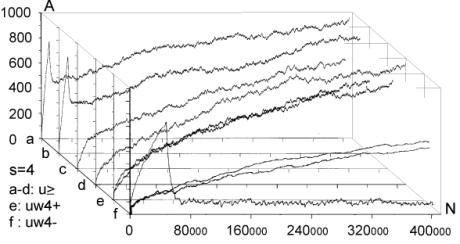
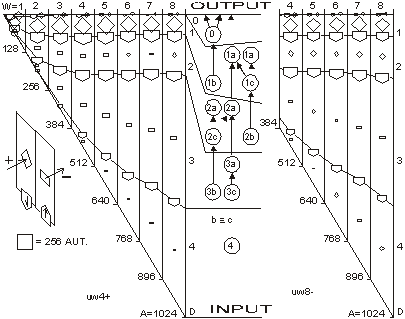
It is easy to note, that our simple algorithm R0 can only calculate the outputs for the aggregate without feedback loops. For the system with feedback loops, the use of the algorithm R0 is not suitable. Because our aggregate are constructed in a random fashion, in a single aggregate there can be a lot of such cyclic loops and these loops may have a lot of common points. For these reasons it is impossible to obtain one stable real output signals vector to compare it to the ideal output vector. However, we do not need to calculate the true output vector to get a correct statistical size of change L. To calculate L we compare outputs of the aggregate before and after the change of the aggregate has been made. We can obtain a distribution of probability of acceptance for change parameters. This is an important remark that allows us to study the structural tendencies in complex systems in our computer-based model system implementation. 4.5.2 Algorithms R1 and R2We first designed algorithm R1, which tries to obtain the most correct output vector by calculating properly all the loops and recursive dependencies. This ambitious direction appeared not to be successful, and to be expensive and needless. We then went on to design a simpler and more fruitful approach. To allow cyclic recursive loops we can make any hypothesis of input signal in any place in the loop, and calculate the loop only one time to obtain the correct statistical area of change. It is not important whether the given chosen hypothesis was accurate or not. It is only important to estimate the correct statistical range of change in output of an aggregate. This is one of the most important differences in our model, when compared to other models. To optimise the time of calculations (time was the main limitation of our simulations) we only re-calculated the changed signals. For each signal in the aggregate, we stored its value from previous calculations; and for circular dependencies in loops as well as for input signals from "not changed area", we used this stored value as a hypothesis. Such a rule of function calculation we call R2. Page 340 4.5.3 Two Maxima of Change Size and a Complexity ThresholdBoth R1 and R2 were used in simulations of the edge model. The results of simulations with the algorithm R2 show that in sufficiently complex systems (complexity above the threshold) there exist two main peaks in the probability distribution of change size (two maxima). Between these two peaks there is a wide area of exactly zero probability. This effect is shown on [Fig. 4]. Depicted on [Fig. 4] distributions are obtained for four consecutive stages of aggregate growth; in each stage aggregate grows by 128 automata. The character of distribution changes in the first 3 stages, when the aggregate is below a particular complexity level. However in the fourth stage the changes cease, the distribution is stable and looks like stage three. The shape of probability distribution of L is our qualitative "measure" of complexity in a system. This is a useful notion that gives us a qualitative distinction between systems that are not complex (below the threshold) and systems that are complex (above the threshold). Most of the authors when discussing complex systems use a proper measure of complexity (e.g. algorithmic complexity [Gell-Mann 95], or Solomonov-Kolmogorov-Chaitin complexity). This is different from our own approach and has different goals. We have obtained one significant but extended threshold and two qualitative states, not a smooth and continuous-valued described system. We have discovered that at a particular level a given system starts to exhibit different and very interesting properties. This phenomenon is similar to a "phase transition" in thermodynamics. In research about complex systems to date there is often a reference to a critical value for a given parameter. For example in scale-free networks [Barabasi 02, Dorogovtsev 03], above a critical network size, average length of the path between two nodes will not change with the growth of the network. Similarly, in self-organising criticality [Bak 96, 88, 87] after some parameters reach a critical value, the system will spontaneously exhibit behaviour characterized by power laws. In our case, this level denotes a transition between a system and a complex system with particular tendencies [Gecow 86]. We have investigated mechanisms of this phenomenon. If the coefficient of change propagation is greater than 1, the change should explode onto the whole network. Due to the statistical nature of our model and the coefficient of change propagation, the change of signals may or may not fade out. Fading out may occur if the automata close to the place where the change occurred will not multiply the change. If the aggregate change occurred towards the "end" of the aggregate and few changed signals ended up in the aggregate output vector, then the probability of fading out is much higher. The probability of this event occurring in a given aggregate may not be very small. If the change fade-out does not occur in the first several steps, then the probability of the change fading out in any following step rapidly drops down. This continues up to a certain level, at which the change increased enough almost all the automata newly infected by the change have two of their inputs changed. At this stage, on average, each infected automata will have less then 2 of its outputs "infected", therefore the change propagation will continue spreading at a lower rate or it may fade out. If the average change propagation coefficient for automata is relatively low, the change may completely fade out then. This mechanism does not depend on the initial position of the change, but it depends on feedback loops present in the system. If feedbacks are present in the system's structure, then the position of the second maximum is constant. Page 341 Figure 4: Threshold of complexity as appearance of zero-frequency area between two peaks in distribution of change size L in sequence stages of aggregate growth. There was an observed independency of second peak of connection parameters and linear dependency between change size on system output (L) and number of changed automata (K). The area between these two peaks equals exactly zero. If there are no feedbacks, the mechanism is similar in the first few steps of the propagation of the change, but later expansion of change depends on the capacity of the cone of influence. It also depends on the initial place of change. In this case the section between the two peaks is near, but not equal to zero. The position of the second maximum depends on the aggregate size. The complexity threshold for a system without feedbacks is different. However for both types of systems, with feedback loops and without, such a threshold exists and gives similar statistical effects. The size of change in the aggregate outputs directly depends on a number of changed automata. [Fig. 4], the right side, shows the frequency distribution of K - number of changed automata and its linear statistical relationship to L (-change size on the output of the aggregate). 4.5.4 Algorithm R3For parameter K the probability distribution is very similar to L. There are two peaks, one for very small K, and the other one for very large K. Both of these peaks are very narrow with sharp slopes, and between them there is a large area of exactly zero probability. Unlike the distribution for L, the second maximum is not fixed, and depends on the number of automata in the aggregate. Once the parameter K reaches the zero-frequency plateau, it must later climb the second peak for K distribution. Page 342 However, all of the cases from the second peak of K distribution, for large K, will not be accepted due to the adaptability condition [Section 3.1, Equation 1] and small change tendency. Therefore, we can stop the calculations of a given case as soon as parameter K reaches the zero frequency plateaus. This is our modifications to the algorithm R2, that we call algorithm R3. Algorithm R3 was fast enough to be used in volume models. 5 Main Structural Tendencies in a Complex System Evolution5.1 Aggregate GrowthDue to the differences in the structure of the evolving aggregate, some tendencies may be expressed with a different strength. On the other hand, the differences in the structure may also be due to different tendencies in the evolutionary process. This is a circular dependency, and to make progress we need to grow the aggregate in a fully controlled way, under the adaptive condition. In the edge model as a change mechanism we have used only addition of new automata. In such circumstances the aggregate is continuously growing. For every single aggregate, we could start with the empty one, and proceed up to the size at which the system exhibited tendencies characteristic for complex system [see Section 4.5.3]. Some experiments required a relatively constant size of the aggregate. Therefore at the end of each stage (addition of 128 automata) we have kept the number of automata fixed, and we were changing the aggregate only by changing the function of randomly selected automata already existing in the aggregate. The results of these experiments are presented on [Fig. 4]. In volume model simulations, the growth of the aggregate is one of the tendencies that occur under the adaptive condition. However, as tendencies are valid only in complex systems (above the complexity threshold) it is a bit problematic to start the simulations with the empty aggregate. In addition to that, we try to use very small value of signals, s=4. The interesting effects in such a simulation configuration exist, but are extreme small. Without the cost function the aggregate should grow, but in first trials with cost we did not obtain aggregate growth. To start the simulations at higher complexity levels, we let the aggregate grow through 6 stages up to 768 automata (only addition operation is active, no removals up to this stage). At this stage (768 automata) we added removal processes and this modification resulted in the aggregate disintegration, [see Fig. 5.f] for reference. Our aim was to obtain sufficiently complex aggregate that would show structural tendencies described before. However, aggregate disintegration after enabling automata removal is a major problem with the current scenario. This required many more experiments to solve this problem. This experience shows that obtained structures are significantly different (and this was expected). It is shown by a growth difference for s=4 without a cost [Fig. 5.a-e], and with initial growth forced by additions alone [Fig. 5.a and 5.b], and without initial growth [Fig. 5.c and 5.d]. There must be some mechanism with the ability to dynamically regulate the additions and removals in aggregate. In this regulatory mechanism removals must depend on the coefficient of change propagation and the probability of change acceptance. Each accepted addition or change of requirements will generate new ability of removals, but to find them time is needed. Page 343 Figure 5: The grow of aggregates as a dynamic balance of additions and removals of automata. Aggregate built without removal is different. With cost for s=4, this mechanism was outside the correct parameters area, possibly due to model simplicity. We have decided to add some elements to the system that could potentially improve the model ability to show the discussed mechanism. First, we have redefined our aptness function b, in such a way, that it was smoother, and it allowed more diversification between different aptnesses for different aggregate cases (more discrete steps in the aptness landscape). We used:
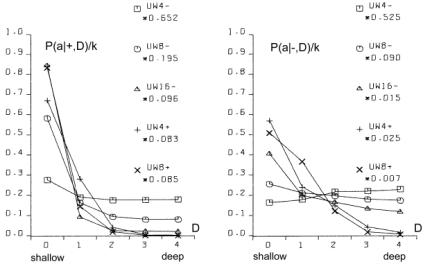
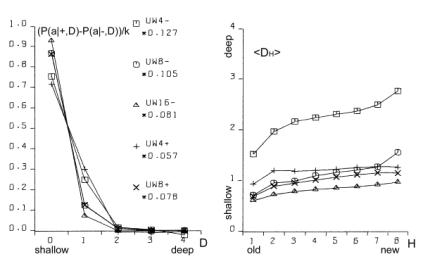
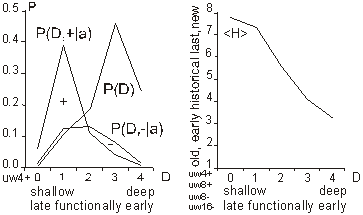
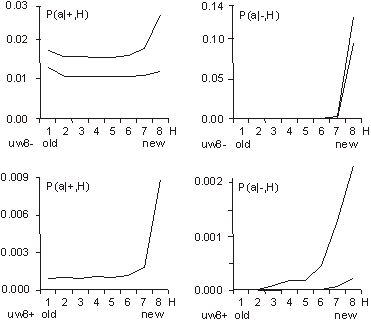
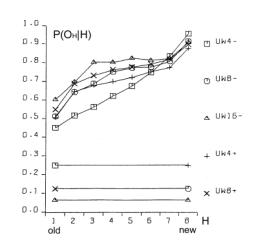
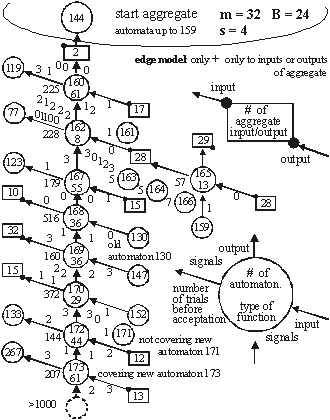
This variant of b gave the expected growth of the aggregate for s=4 with cost [Fig. 5.f]. Second, we tried one big change of requirements instead of many small changes; this however did not give expected growth of the aggregate. Both of these modifications did not give any visible effects without cost ([Fig. 5.e] looks exactly the same as [Fig. 5.c and 5.d]). In summary, the most important aspect is the coefficient of change propagation w, which is dependent on s. When w=1.3 (usually 1.49) then there is no growth for s=4 with cost [Fig. 5.f]. For bigger s, for example s=8, s=16, we can observe a stable growth of the aggregate. The other important aspect of aggregate growth is the ability of the evolutionary process to remove the transparent automata. This aspect, however, is very difficult for formal treatment and needs further research. 5.2 Terminal Modifications and Conservation of Deeper PartsThe main tendency is terminal modifications [Naef, 17] and conservation of deeper parts of the aggregate. The description of the depth D that we refer here has been introduced in [Section 4.3] and it is explained in [Fig. 8]. Page 344 We use here aggregate structural relationships to denote functional order. The mechanism of this tendency is based on the probability of change fading out. The probability of the change fading out is highest if the initial point of change is close to the aggregate's outputs and changed signals can stop rapidly as aggregate output signals, without the ability to spread widely into other automata. This mechanism strongly depends on the coefficient of change propagation w and then on s. Figure 6: Functionally terminal additions and removals in simulations. In [Fig. 6], the distribution of the probability of acceptance is shown in relation to depth D. On the left side - for addition and on the right side for removals of automata in five different simulations (s=4,8,16 without cost function marked with minus sign "-" in simulation name and for s=4,8 with cost function marked with "+"). The probability P(a|±,D), where "+" means addition and "-" means removal, is normalised by coefficient k shown on picture for better comparison. Only for s=4 without cost results are different and there is no tendency in removal. For higher s or with cost the tendency is stronger. As can be seen in [Fig. 8 and 9], depth D=0 is very narrow, but in this case the probability of acceptance is extremely high. The terminal modifications tendency applies to any changes - additions and subtractions as sources of initiations changes in structure of aggregate. In order to refer to the special meaning of the addition new automata in the creation of similarity of historic and functional sequence, the terminal modifications tendency for addition is named the terminal addition tendency for convenience. Page 345 5.3 Terminal Majority of Addition and Simplification of Deeper PartsDifferences between addition and removals, visible in [Fig. 6], create three other tendencies: terminal majority of addition and simplification of deeper parts of the aggregate (discussed below) and aggregate growth (discussed above). Figure 7: Functionally terminal majority of additions and simplification of functionally deeper parts of the aggregate (left). Average depth of connection of automata of aggregate on the right, is much lower then the aggregate with randomly connected automata, [see Fig. 9]. The difference between the number of accepted additions and removals is different in different places of structure of the aggregate. There is a race between creation of new abilities for removals by additions and finding a possible automaton to be removed. Due to the statistical nature of removals, automata that stayed in the structure for longer periods, have a bigger chance of being tried to be removed. In shallow parts of the aggregate (close to the system outputs), due to the terminal additions tendency, additions win (that is, additions are much more frequent). However in deeper parts of the aggregate, where automata have been present for a relatively long time, the situation is different. Automata there have much more chance to be removed. In the deeper parts of the structure there are different densities of automata able to be removed than in the shallow parts. The term "terminal modifications" means, that most of the accepted changes take their place in shallow parts of the structure. This tendency means that in deeper parts of the structure there are fewer changes. However, terminal majority of addition does not mean that in deeper parts there is a majority of removals. The second, much more crucial tendency is "simplification tendency". For this one, a majority of removals is necessary. This tendency is much more desirable, yet it is not expressed as strongly as terminal majority of addition. Page 346 Figure 8: Functionally terminal majority of additions, simplification of deeper parts of aggregate and shunting back. Left side: s=4 with cost, right side: s=8 without cost. In the middle there is a specification of depth D - structural measure of functional order. W - stage of aggregate grow. Flow of automata through the border of depth and balance of addition and removal in function of depth. In the experiments terminal majority of addition occurs strongly (see the left side of [Fig. 7] and [Fig. 8]). However, measurements of tendency for simplification of functionally deeper parts are not statistically significant. In all runs of simulations, the somehow weak tendency can be seen and confirmed. In [Fig. 7] the simplification tendency is too small to be observed, but in [Fig. 8], for s=4, it is visible from depth D=2, and for s=8, it weakly appears from D=3. In [Fig. 8] the large triangle depicts growing aggregate in consecutive stages W. In each stage aggregate grows by 128 automata. In the middle of the [Fig. 8], there is specification of depth D - the structural measure of functional order. Aggregates on both sides are divided by this depth. In each stage and depth, the difference between additions and removals is shown as a square, for more additions, and a rectangle, for more removals. As you can see, there is much more addition in depth D=1. The right aggregate (s=8 without cost) is shown from stage W=4 (starts from 384 automata), because from this stage the aggregate is surely a complex system. All results presented on [Fig. 6, 7, 9, 10 and 11] are obtain from the stage 4 onwards (without stages 1-3). Page 347 5.4 Shunting BackTerminal additions together with terminal majority of additions forces the aggregate's shallow automata to be pushed deeper and deeper in the aggregate structure (see right side in [Fig. 7]). This looks like shunting back [Weisman 04, Holmes 44]. [Fig. 8] shows a strong stream down, as constant volume of shallow depth cannot hold all newly added automata. Of course, this is only an interpretation, because all automata stay in their place without moving. New automata are placed on top of the existing ones. It should rather be understood as building up on an old, ready foundation, or base. If there is a process actively removing some automata from the parts of the aggregate close to its inputs, then it will make some automata from the higher parts of the aggregate to be pushed down. That is, when counted from the input of the aggregate, automata occupying higher levels will be pushed to lower levels. This is exactly what shunting back represents. 5.5 Similarity of Historical and Functional OrderThe tendencies described above, terminal addition and terminal majority of additions, result in a close similarity between historical and functional order (see right side of [Fig. 9]). Automata added at the earlier stages of evolution of the aggregate occupy deeper parts of the structure, near inputs of the aggregate. In terms of the functional order these automata are earlier in the functional dependency graph. Automata added later during the evolution, that is younger automata, are occupying shallower regions of the structure, near outputs of the aggregate. This is an evident occurrence, and it represents a significant statistical dependency. In all simulations, except s=4 without cost, these dependencies are identical and statistically significant. Due to this similarity, we can expect all the above discussed functional tendencies to appear also in historical sequence. Therefore we have used above (for descriptions to [Fig. 6, 7, 8 and 9]) the term "functional" to distinguish the terms "terminal" (late, shallow) and "deeper" (early) from the historical sequence. In simulations we have obtained historical terminal modifications tendency in both cases - for additions and removals. In [Fig. 10] we show these tendencies and we presented the influence of the cost function (for s=8, with and without cost). We show also the participation of transparent automata. The participation of transparent automata in case without cost is near 2/3 for additions and even higher for removals. Transparent automata were removed in a very short time after their addition. In models with cost there is a visible historical terminal majority of additions. In cases without cost and for s=8, there is no such tendency, as you see comparing left and right graphs. We partition all the automata of the aggregate into 8 groups, 1 to 8, according to the sequence at which these automata were added to the aggregate. The latest additions will be in group 8, and the earliest in group 1. The number of the group we refer to as H. In graph of P(a|+,H) parameter H refers to the automaton that received the output signal of a newly added automaton. This is then averaged with the second output value, and for this reason for old parts probability is not close to zero. Page 348 Figure 9: Distribution of change frequency in depths for free process and accepted additions and removals for s=4 with cost. Functional terminal modification can be observed. Similarity of historic and functional order (all simulations without: s=4 without cost). Figure 10: Historical terminal modification tendency for additions and removal in simulations: s = 8 without (uw8-) and with (uw8+) cost. Lower curve shows participation of transparent automata. Page 349 5.6 Recapitulation Old States Deep in a System StructureTendencies of historical and functional terminal additions and conservation of older and deeper parts of aggregate, together with terminal majority of additions, through shunting back as building up, create a situation that in deeper, old parts of the aggregate there are structures similar to the old state of the whole aggregate. The older substructures are contained within younger regions of the aggregate. The outputs of these substructures, that previously were outputs of the aggregate, appear according to the functional order. This phenomenon is called recapitulation of older states deep in the structure. This is statistically significant phenomena and should be easily visible. To establish the level of conservation of these substructures, we have measured the frequency of conservation of the original output signals. The results are presented in [Fig. 11]. Only in the early stages, when the automaton is still placed very shallow (H=8), it is possible for it to change its output signals. Later (H=7 to H=3) there is visible conservation of its output signals. For automata with H=1 and H=2 the aggregate was still not complex. Figure 11: Stability of function (output signals from time of addition) of automata. Also random levels are shown. 5.7 CoveringIf the input signals to the aggregate are changed (environment is changed), then in most cases, the only way for the system to maintain its aptness level (to survive) is to rebuild within the system itself previous environmental signals. It can be done in many ways. Nevertheless, each method must reconstruct a function of the aggregate by changing it in functionally a very early place. In a complex system the correction must be made near to the source of the dysfunction. The easiest and universal way is to add a new automaton to the changed input of the aggregate, which converts the new input signal to the old one. This new automaton repairing the old input signal, we call cover, and the tendency to use this mechanism: covering. Page 350 Figure 12: Mechanism of covering - simulation results in detail. Only when a new signal on input 2 gave the same function new automata was not a cover. Covering has been investigated in the early stages of our research [Gecow 83]. Due to limited resources we have used only an edge model (only addition only on edge - to input or output of the aggregate) and number of inputs / outputs was shortened to m=32. The covering effects are clearly visible, as shown in [Fig. 12]. On the right-hand side, there is given a description of the numerical value of appropriate input or output signals of the aggregate. For example, the value in the rectangle represents a symbolic numerical name of the given input/output of the aggregate. Bottom number (in a circle) represents a symbolic name of the automaton function for transforming inputs into outputs. For our simulations we have randomly generated 64 of such functions. By the inputs and outputs of the automaton, we provide the actual values for the signals being passed. As shown, automata were attached somewhere to the aggregate only when a new signal on input numbered "2" maintained the original function of the aggregate. The change faded out after a single or the first two steps (automata 161, 163, 164, 166 and 171). Covering is here a very strongly expressed tendency. Page 351 Covering is a very important and interesting tendency, and should be investigated further in more detail. For that a new, more robust and improved model needs to be developed. It will have fundamental theoretical and practical implications. 5.8 Other Tendencies[Fig. 13] shows another simple yet interesting tendency: specialisation for aggregates developed in diverse environments. In all of the environments there are some special requirements, ideals. If an aggregate can acquire a method to avoid one of the environments (the least frequent one), then it can adapt faster to the remaining ones. However, after one of the environments is excluded for a few changes, it is very difficult for an aggregate to accommodate that single environment again. Figure 13: Tendency of specialization. Figure 14: Tendency of integration - after long common evolution earlier independent systems must later develop together. Page 352 There is another, more complex and important problem, that of integrity. [Fig. 14] shows a few events during the process of creating a new higher-level super-aggregate (that we refer to as integron). After long common evolution, earlier independent systems must later develop together. In effect, we expect a structure of higher-level integrons, because of the earlier described tendencies of conservations of old areas of an aggregate structure. In [Fig. 14] - aggregate 2 works as a cover for aggregate 3; 2,3,4,5 - are common automata; 5 - common cover. Environments of early aggregates may be independent, but during evolution they lose their independence and they use a mixture of environments, properties and requirements. To create a higher-level integron, we do not need to increment aptness requirements - long coexistence is enough. This is an example of simple co-evolutionary behaviour. 6 Summary and Future WorkIt is believed by many researchers in computer science that software systems are soon to reach biological levels of complexity. Hardware systems, with their high levels of integration are not far behind. For these reasons, computing systems are becoming a natural metaphor for an organism as a whole, not only for a brain [Neumann 58]. When observing large software systems it is easy to draw parallels to biological evolutionary processes. For such large software systems (like operating systems), it is very difficult to implement some new functionality by modifying the existing structures. It is much simpler to provide needed functionality on top, or parallel to the existing one, therefore the system is being constantly patched, in a similar way to the patching of genetic codes done by natural evolutionary processes [Chaitin 79]. The main aim of our work is, first, to develop a theory and then to develop tools and frameworks for automatic maintenance and automatic adaptation of software systems in dynamic environments. In this article we have addressed the theoretical aspects of our main objective. We have described a system exhibiting particular properties above a certain level of complexity. This threshold level has a statistical character and it is commonly referred by other researchers as a phase transition. In the presented model we have observed and investigated this effect. We have also investigated structural tendencies of a developing complex system. These are statistically significant, very strong, and we believe that they will occur in any development of complex software system, independently of the development method used. That means, regardless of the origins of changes to the system, whether the changes are generated randomly by some stochastic process, or whether the changes are generated by a team of programmers following a formal software methodology and coordinated centrally, these tendencies should be visible (at least to a certain degree). This is because all these tendencies are results of relatively simple statistical relationships emerging in systems with complexity above the discussed threshold. Interestingly, coming independently from two different set of basic definitions and assumptions, both models ([Chaitin 79] and [Gecow 75, 83] achieved the same conclusions. The process of improvement and the system growth are being accomplished by carrying along all the previously developed structure, as new pieces of the structure are added [Simon 68]. The simulations and statistical analyses together replicate similar conclusions of Chaitin. Page 353 The experimental proof of this is that ontogeny recapitulates phylogeny, i.e. each embryo to a certain extent recapitulates in the course of its development the evolutionary sequence that led to it [Chaitin 79]. The preliminary results based on the finite-state automata model discussed in the previous sections present very promising tendencies and robustness. Note, that this is the first such detailed exploration of structural tendencies. These phenomena have potential usefulness for complex and adaptive software development. In the discussed scenario the model exhibited self-adaptability and could be successfully used in some applications with binary input-output signals. Based on obtained results we can identify some of the properties an efficient automatic change generator needs to exhibit. These include among other things, the following guidelines:
Future work will include a) formal definitions together with analysis of aggregation of aggregations, b) automatic change generators that exhibit changes with high probability of acceptance needs to be further explored and investigated; c) more experimental data needs to be collected, and bigger real-life problems must be tested and evaluated. A better understanding of the necessary reflective capabilities is also required. Applications in the fields of evolutionary computation and artificial life are possible and are also planned as future work. One of the interesting tendencies described in this work is specialization and integration. These mechanisms have a potential crucial role in practical aspects of software maintenance. However, they may also have an important role in biological and philosophical aspects of the theory of life. These will be addressed in future publications. References[Albert 02] R. Albert, A.-L. Barabási, Statistical mechanics of complex networks. Rev. Mod. Phys., Vol. 74, No. 1, 2002, 47-97 [Albert 00] R. Albert, A.-L. Barabási, Dynamics of Complex Systems: Scaling Laws for the Period of Boolean Networks. Phys. Rev. Lett. Vol. 84 No. 24, 2000, 5660-5663 [Bak 96] P. Bak, How Nature Works. Springer-Verlag, New York, 1996 [Bak 88] P. Bak, C. Tang, K. Wiesenfeld, Self-organized criticality. Phys. Rev. A, 38, 1988, 364-374 [Bak 87] P. Bak, C. Tang, K. Wiesenfeld, Self-organized criticality: An explanation of 1/f noise. Phys. Rev. Lett., 59, 1987, 381-384 [Barabasi 03] A.-L. Barabási, E. Bonabeau, Scale-Free Networks, Scientific American, www.sciam.com 2003, 50-59 [Barabasi 02] A.-L. Barabási, Linked: The New Science of Networks. Massachusetts: Persus Publishing, 2002 Page 354 [Barabasi 99] A.-L. Barabási, R. Albert, H. Jeong, Mean-field theory for scale-free random networks. Physica A 272, 1999, 173-187 [Capra 96] F. Capra, The Web of Life: A New Understanding of Living Systems. New York: Anchor Books/Doubleday, 1996 [Chaitin 79] G.J. Chaitin, Toward a mathematical definition of "life". In Levine, R.D., Tribus, M., eds.: The Maximum Entropy Formalism. MIT Press, 1979, 477-498 [Chaitin 70] G.J. Chaitin, To a mathematical definition of 'life'. ACM SICACT News 4, 1970, 12-18 [Darwin 59] C. Darwin, On the Origin of Species by Means of Natural Selection. John Murray, 1859 [Dorogovtsev 03] S. N. Dorogovtsev, J. F. F. Mendes, Evolution of Networks: From Biological Nets to the Internet and WWW. New York: Oxford University Press, 2003 [Dorogovtsev 00] S. N. Dorogovtsev, J. F. F. Mendes, A. N. Samukhin, Structure of Growing Networks with Preferential Linking. Phys. Rev. Lett. Vol. 85, 2000, 4633 [Eigen 79] M. Eigen, P. Schuster, The Hypercycle: A Principle of Natural Self-Organization. Springer-Verlag, 1979 [Gecow 86] A. Gecow, Statistical analysis of structural tendencies in complex systems vs. ontogeny. PhD thesis, Instytut Badan Systemowych PAN, Warsaw, Poland, 1986 [Gecow 83] A. Gecow, A. Hoffman, Self-improvement in a complex cybernetic system and its implication for biology. Acta Biotheoretica 32, 1983, 61-71 [Gecow 75] A. Gecow, A cybernetical model of improving and its application to the evolution and ontogenesis description. In: Proceedings of Fifth International Congress of Biomathematics. Paris, 1975, 48-57 [Gell-Mann 95] M. Gell-Mann, What Is Complexity? John Wiley and Sons, Inc., 1995 [Gould 77] S.J. Gould, N. Eldredge, Punctuated equilibria: the tempo and mode of evolution reconsidered. Paleobiology 3, 1977, 115-151 [Holmes 44] S.J. Holmes, Recapitulation and Its Supposed Causes. The Quartely Review of Biology, Vol.19, No.4, 1944, 319-331 [Holyst 04] J.A. Holyst, A.Fronczak, and P.Fronczak, Supremacy distribution in evolving networks. Phys. Rev. E 70, 046119, 2004 [Kauffman 93] S. Kauffman, The Origins of Order. Oxford University Press, New York, 1993 [Kokar 99] M. Kokar, K.Baclawski, Eracar A., Control theory-based foundations of self-controlling software. IEEE Intelligent Systems, 1999, 37-45 [Koza 92] J.R. Koza, On the Programming of Computers by Means of Natural Selection. MIT Press, 1992 [Meng 00] A.C.Meng, On evaluating self-adaptive software. In Robertson P., Shrobe H., Laddaga R., eds.: Self-Adaptive Software. Number 1936 in LNCS. Springer-Verlag, Oxford, UK 2000, 65-74 IWSAS, 2000, Revised Papers. [Naef 17] A.Naef, Die individuelle Entwicklung organischen Formen als Urkunde ihrer Stammesgeschichte. Jena, 1917 Page 355 [Neumann 66] J.L. von Neumann, Theory of self-reproducing automata. ed. A. W. Burks, University of Illinois, USA, 1966 [Neumann 63] J.L. von Neumann, The general and logical theory of automata. In Taub, A.H., ed.: J. Neumann - Collected Works. Volume~ V.Macmillan, New York, 1963, 288-328 [Neumann 58] J.L. von Neumann, The Computer and the Brain. Silliman Lectures Series, Yale Univ, Press, New Haven, CT, 1958 [Orgel 73] L.E.Orgel, The Origins of Life: Molecules and Natural Selection. Wiley, New York, 1983, 187-197 [Pastor-Satorras 04] R.Pastor-Satorras, A.Vespignani, Evolution and Structure of the Internet: A Statistical Physics Approach. Cambridge University Press, February, 2004 [Purvis 00] M.Purvis, S.Cranefield, G.Bush, D.Carter, B.McKinlay, M.Nowostawski, R.Ward, The NZDIS Project: an Agent-based Distributed Information Systems Architecture", in CDROM Proceedings of the Hawaii International Conference on System Sciences (HICSS-33), editor R.H. Sprague, Jr., IEEE Computer Society Press, 2000 [Shannon, 49] C.E. Shannon, W. Weaver, The Mathematical Theory of Communication. University of Illinois Press, 1949 [Simon 68] H.A. Simon, The sciences of the artificial. MIT Press 1968 [Stauffer 96] D. Stauffer, Cellular Automata, Ch. 9. pp. 339-365, in A. Bunde, S. Havlin (eds.) Fractals and Disordered Systems. Springer-Verlag, Berlin Heidelberg, 1991,1996 [Weisbuch 88] G. Weisbuch, Complex Systems, organization and networks of automata. in L.Peliti, A.Vulpiani (eds.), Measures of Complexity. Lecture Notes in Physics, no.314, Springer Verlag, 1988, 128-138 [Weismann 04] A. Weismann, The Evolution Theory. 2 vols. London, 1904, 185 [Vose 99] M.D.Vose, The Simple Genetic Algorithm: Foundations and Theory. A Bradford Book, The MIT Press. 1999 Page 356 |
|||||||||||||||||||||||||||