| Submission Procedure |
Requirements Negotiation Using Multi-Criteria Preference AnalysisHoh Peter In David Olson Abstract: Many software projects have failed because their requirements were poorly negotiated among stakeholders. Reaching agreements of negotiated requirements among stakeholders who have different concerns, responsibilities, and priorities is quite challenging. Formal (fully-automated) approaches of requirements negotiation require significant efforts of knowledge representation and validation, whereas informal (manual) approaches do not provide systematic methods of requirements negotiation. This paper proposes a novel light-weighted, yet systematic requirements negotiation model, called "Multi-Criteria Preference Analysis Requirements Negotiation (MPARN)" to guide stakeholders to evaluate, negotiate, and agree upon alternatives among stakeholders using multi-criteria preference analysis theory. This eight-step MPARN model was applied to requirements gathered for an industrial-academic repository system. The result showed that the MPARN model assisted stakeholders to have unbiased aspects within a requirements negotiation in a light-weighted way and increase stakeholders' levels of cooperation and trust by measuring each stakeholder's preference and value function explicitly through a step-by-step process. Key Words: conflict resolution, inconsistency management, requirements negotiation, multi-criteria preference analysis, WinWin 1 IntroductionMany software projects have failed because their requirements were poorly negotiated among stakeholders [Boehm, 1996a]. The importance of requirements negotiation was addressed by a number of keynote speakers at the International Conference on Software Engineering (ICSE) as follows:
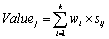
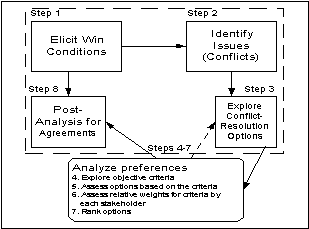
Page 306 It is quite challenging to reach agreements of negotiated requirements among stakeholders who have different concerns, responsibilities, and priorities. There are various approaches to solve this requirements negotiation. Formal, i.e., fully-automated, approaches detect automatically conflicts (or inconsistency) of requirements among stakeholders by representing knowledge of stakeholders' perspective, system domains, and conflict patterns, and resolving conflicts in a systematic way [see Section 6]. However, it requires significant efforts to elicit, capture, represent such knowledge and validate the reasoning results. Contrarily, an informal (or semi-automated) approach such as Win-Win [Boehm, 1994][Boehm, 1995][Boehm, 1999] provides a general framework for requirements negotiation without significant efforts of capturing, building, and reasoning knowledge base. However, it does not provide a systematic reasoning of how to resolve conflicts. When the stakeholders identify conflicts, especially, it is an ad-hoc process to reach an agreement from alternatives (called "options") to resolve conflicts. In this paper, we propose a light-weight, yet systematic model to guide stakeholders from conflict-resolution options to agreements using multi-criteria preference analysis techniques. We call this model the Multi-Criteria Preference Analysis Requirements Negotiation (MPARN) model. MPARN cooperates with a general, yet light-weighted framework of requirements negotiation, WinWin, to utilize the artifacts of the win-win analysis, e.g., win conditions, issues, options, and agreements. In addition, MPARN applies multi-criteria preference analysis techniques to provide a systematic guidance to resolve conflicts. We show how to negotiate options for reaching agreements using the multi-criteria techniques with an example, a USC/CSE library repository system. Multi-criteria methodology potentially increases stakeholders' levels of cooperation and trust without losing participants by removing as much bias as possible from a problem analysis, and providing a better communication process. The rest of the paper is organised as follows: [Section 2] describes the context of the work; [Section 3] describes the proposed MPARN steps; [Section 4] demonstrates the approach with the repository system example; [Section 5] and [Section 6] present future research challenges and related work; finally, we present some conclusions in [Section 7]. 2 ContextIn this section, we present background information about the WinWin negotiation model and multi-criteria preference analysis. 2.1 WinWin Negotiation ModelThe WinWin model provides a general framework for identifying and resolving requirement conflicts by eliciting and negotiating artifacts such as win conditions, issues, options, and agreements. The WinWin model uses Theory W [Boehm, 1989] ("Make everyone a winner") to generate the stakeholder win-win situation incrementally through the Spiral Model. WinWin assists stakeholders to identify and negotiate issues, i.e., conflicts among their win conditions, since the goal of Theory W involves stakeholders identifying their win conditions, and reconciling conflicts among win conditions. Page 307 The dotted-lined box (steps 1, 2, 3, and 8) shown in [Fig. 1] presents the WinWin negotiation. Stakeholders begin by entering their win conditions (step 1). If a conflict among stakeholders' win conditions is determined, an issue schema is composed, summarizing the conflict and the win conditions it involves (step 2). For each issue, stakeholders prepare candidate option schemas addressing the issue (step 3). Stakeholders then evaluate the options, delay decision on some, agree to reject others, and ultimately converge on a mutually satisfactory, i.e., win-win, option. The adoption of this option is formally proposed and ratified by an agreement schema, including a check to ensure that the stakeholders' iterated win conditions are indeed covered by the agreement (step 8). Usage experience also indicates that WinWin is not a panacea for all conflict situations, but generally increases the stakeholders' levels of cooperation and trust [Boehm, 1999][In, 2001]. Agreement is not always guaranteed. There are often tradeoffs among win conditions that need to be balanced. Multi-criteria preference analysis provides a means to balance these tradeoffs, and a framework for discussion that can lead to resolution. 2.2 Multi-Criteria Preference AnalysisPreference analysis is incorporated into this process at this time, to generate the criteria to be considered by the group, to assess alternative performance on each criterion, and to elicit each group participant's relative preference over criteria. Multiple criteria decision-making theory presumes that rational decision makers have a preference function reflecting tradeoffs among conflicting criteria [Dyer, 1979][Keeney, 1976]. While non-linearities can arise due to interactions among criteria, the most common form of preference function is:
where k is the number of criteria, and j represents the alternative under consideration. Variable wi represents the relative importance of criterion i and variable sij represents the relative attainment of alternative j on criterion i. Each rational individual is expected to have such preference function if their value function reflects tradeoffs. Preference analysis can be a useful tool in identifying the value of each alternative's features to individual group members. This in turn can be used for guiding discussion to key issues, and possibly as a basis for aggregation of individual preference functions into a group preference function. Sensitivity analysis can also be used to identify the implications of changes in various inputs to the aggregated group preference function. These tools may aid in reconciling issues among group participants, and lead to a more acceptable and higher quality decision. The next section explains how multi-criteria analysis can be incorporated into the Win-Win process. Page 308 3 The MPARN ProcessThe MPARN process shown in [Fig. 1] begins with the win-win process, which leads to elicit what stakeholders need, identify conflicts in these needs among the stakeholders, explore of conflict-resolution options. Multi-criteria preference analysis is proposed here as a means to supplement the win-win process of systematically evaluating and negotiating conflict-resolution options by eliciting stakeholder preferences and criteria, as well as assessing how well each of the generated options performs on the set of criteria. The process may lead to agreement by itself, although this is not guaranteed. Review of each stakeholder's win conditions at this final stage may further aid the next cycle of reconciliation or compromise in the WinWin Spiral Process model. Figure 1: The process of MPARN. The steps shown in [Fig. 1] are elaborated next. A detailed example will be presented in [Section 4]. Elicit Win Condition (Step 1): Each stakeholder identifies his orher win conditions. This step provides the basis for identification of ideal project features by stakeholders. Identify Issues or Conflicts (Step 2): The lists of win conditions are then reviewed, identifying conflicts. This enables identification of conflicts. The step is accomplished in categories of direct conflict, as well as potential conflict. This step may be accomplished manually. Semi-automatic approaches such as [In, 2001] and [Ruiz, 2001] are proposed to incorporate software agents. Explore Conflict-Resolution Options (Step 3): The stakeholders can use the understanding gained from Step 2 to generate conflict-resolution options. It is best to generate a list of options which may emphasize those characteristics preferred by each stakeholder, but that include some balance representing needed conditions of all stakeholders. Page 309 Explore Objective Criteria (Step 4): The process of identifying preference functions begins with the expression of criteria of importance, followed by the identification of the options under consideration, their scoring on the criteria identified, and the elicitation of tradeoff relationships. The generation of the list of criteria would be highly suitable for a group support system session [Gruenbacher, 2001]. An initial brainstorming would be ideal for expression of important features of a proposed system. Regardless of the methodology used to obtain the criteria, options currently active could be assessed in another group session to evaluate their relative performance on the criteria generated in the initial session. Next, each stakeholder could assess their tradeoff functions. The purpose is to share characteristics of options that are considered highly important to the other stakeholders. Sharing preferences in this manner, a better understanding of what other stakeholders want serves as the basis for design of superior systems. Assess Options based on the Criteria (Step 5): Once this list of criteria is developed, each stakeholder assesses each option's performance on each criterion. Scores (sij) are assessed for each option on each criterion. Scores need to reflect how each stakeholder values the performance of each option on each criterion. There are many ways to do this. If a great deal of personal judgment is appropriate, this can and should be a subjective assessment, with the individual expressing the relative value of the option on each particular criterion. In other contexts, if clear measures on an objective scale are available, these measures can be used directly (in which case weights wi need to be adjusted to reflect differences in measurement scales as well as criterion importance). There are many approaches that have been developed to assess scores [see Section 4]. Assess Relative Criteria Weights by Stakeholder (Step 6): The next step is to obtain relative weights for criteria by each stakeholder. As with value scores, there are many ways to do this [Choo, 1999]. Four methods are illustrated in [Section 4]. Rank Options (Step 7): The prior steps provide sufficient information to identify the preference ranking over the options for each stakeholder of the group, through a value function given earlier, the sum product of weights times scores for each option over all criteria. If all of the stakeholders obtained the same preferred first choice, the decision process could stop at this point of group unanimity. If reconciliation is required, a number of ways of accomplishing this step are explained in [Section 4]. The spirit of win-win is to get everyone to support the adopted approach. Use of these methods is meant to identify differences as a starting point for discussion. Stakeholders whose original positions are not adopted gain understanding from the process because the reasons for the selection of alternative options are made explicit. Post-Analysis for Agreements (Step 8): This step seeks to attain stakeholder convergence on a solution satisfactory to all. The proposed process provides a systematic means of identifying the win conditions of all stakeholders, and the multi-criteria analysis quantifies each stakeholder's view of each option's performance on each criterion considered important. Page 310 4 An Exercise: A USC/CSE Repository SystemThe following application of preference analysis is extrapolated from a hypothetical case study. The Center for Software Engineering at the University of Southern California hosted a series of meetings with their business and academic affiliates in order to determine requirements for an online repository of research reports and empirical studies. The sessions followed the easyWinWin methodology using GroupSystem's electronic meeting system GSWin. Our paper uses some of the issues identified in one of the projects in order to illustrate the use of preference analysis. 4.1 Elicit Win ConditionsFour stakeholders were identified in implementing a digital library project: a representative user, the user's manager, i.e., customer, the project manager, and the system designer, i.e., developer. These stakeholders engaged in a brainstorming session on a group support system, yielding the win conditions in [Tab. 1]. System Designer S1 Familiar development software and tools S2 Simple project design with single format specified S3 Sufficient time budgeted S4 Break web pages into manageable size Table 1: Win conditions by stakeholders Page 311 4.2 Identify Issues (Conflicts)This list of win conditions involves some conflicts. For instance, there is an inherent conflict in user condition U2 (widespread accessibility) and manager conditions M6 and M7 (greater control of accessibility). User condition U1 directly conflicts with designer condition S2. [Tab. 2] lists win conditions with conflicts on the left. Each row then shows other win conditions with which there are clear direct conflicts, as well as potential conflicts (such as U1 - documents deliverable in multiple formats conflicting with M1 - inexpensive training, and M2 - completion of project within two months). Quality, schedule, and cost are often in conflict. Quality is attained through system functionality. All user requirements call for functionality that inherently has cost, but only those win conditions listed for other reasons are included in the table. Manager's win conditions M4 through M7 also inherently involve functionality incurring added cost as well. Functionality items also inherently conflict with time, the minimization of which is represented by system designer condition S3. Table 2: Win condition conflicts 4.3 Explore Conflict-Resolution OptionsThe next step is to generate conflict-resolution options. To resolve the cost and schedule conflicts that have complicated dependency with other conflicts, for example, we suggested that a solution be generated representing an ideal solution for each stakeholder. For instance, a system with all of the functionality satisfying the win conditions of the user would be expected to be the highest quality solution, although it would likely have a relatively high cost and schedule requirement, and may have other conflicts with managerial security requirements. The ideal system from the perspective of the user's manager would be simpler, more secure, and less expensive. It is quite likely that different levels of tradeoff among these basic factors are possible, in which case system alternatives representing various levels of tradeoff can be included. The project manager and the system designer may share an ideal solution, one that is easiest for the development group to build, while providing specified functionality. Four initial solutions are shown in [Tab. 3]. Page 312 Note that we assume that organizations have their own methods to estimate cost and schedule. We are not proposing new methods of cost and schedule estimation. Now the process enters multiattribute utility analysis, focusing on individual preference function identification.
Table 3: Initial options 4.4 Explore Objective CriteriaThe preference function approach requires identification of the list of criteria reflecting option differences over factors of importance to stakeholders. [Tab. 4] gives such a list of criteria for the example. There were five primary criteria by clustering the stakeholders' win conditions.
Table 4: Criteria 4.5 Assess Option Scores based on the CriteriaFour different ways to assess option score were explored: direct, linear, nonlinear, and geometrical progressing scale. For explanation purpose, we present all four assessment methods here. However, according to our experience, direct assessment is a simple and appropriate method for requirements negotiation because there is often not much available information in early life stages, except experts' qualitative judgment and experience. If the data for cost estimation are available, e.g., from COCOMO, the non-linear scale assessment is useful. Case 1. Direct assessment. With respect to functionality, the user may not care about each of the criteria listed in [Tab. 4], but some of these elements would be extremely important to the user. The user's ideal level (assessment value: 1.0) and the worst imaginable level (assessment value: 0.0) system functionality for the user might include U1, U2, U3, U4, and U7, as shown in the following table: Page 313
The user would assess such a system with a functionality score of 0. Other systems with functionality between these extremes would be assigned scores by the user between 0 and 1, reflecting the relative value to the user by the closeness to 1. Since each stakeholder would value functionality individually, scores for the same stakeholder should be allowed to vary across stakeholders. The anchors can be provided to allow each stakeholder to express their value assessment on each criterion based on as much complete understanding as possible. User's direct assessments on a 0-1 scale of the four alternatives in [Tab. 3] are given in the third column of [Tab. 5] (user weights for four options on five criteria). Table 5: Alternative scores by individual Page 314 Case 2: Linear scale assessment. The user's manager, i.e., the customer who is funding the project, may have a different basis for evaluating functionality. The user manager's ideal level of functionality might consist of:
The user manager's assessment of scores uses a linear function based on objective measures for the alternatives. Costs for each of the alternatives are given with apparent precision (although it is realized that cost estimates are some of the least precise measures known to mankind). A precise mathematical function to convert any project cost (between anchors) to a value between 0 and 1 can be generated. The best imaginable cost could be assigned a value of 1. The worst imaginable cost could be assigned a value of 0. The project manager may choose to develop a completely value function for any cost between these extremes. In this case, the worst imaginable cost for this type of project might be $550,000, and the least expense that the project manager could imagine that would accomplish the needed work might be $50,000. The project manager's value function would therefore be:
In this case, the user manager's linear value function based on objective measures for each project would be as found in [Tab. 5] (User Manager's assessment of cost for each of the four alternatives). Case 3: Non-linear scale assessment. The project manager might have a different conception of the anchor values, such as a worst imaginable cost of $500,000, and a best possible cost of $100,000. The cost associated with a function value of 0.5 might be estimated as $350,000. A commonly used function is of the form: value = A + Be-cxcost In this case, the manager provides three value assessments:
Page 315 These three points give the minimal input required to solve for the values of A, B, and C, the parameters of this function, which allows either high cost aversion or the reverse. The resulting function would be: value=-0.5430 + 0.4182 x e 0.000002611xproject cost In either linear or nonlinear forms, any cost between the given minimum and maximum can be calculated. The use of a nonlinear function over objective measures is applied for the project manager in the fourth column, the second row of [Tab. 5] (Project Manager's assessment of value for costs of all four alternatives). Case 4: Geometrically progressing scale assessment. Another way to assess scores is to use a geometric pattern assigning the best measure a score of 1.0, the second best 0.5, the third 0.25, and the fourth 0.12. This approach avoids requiring expression of the degree of value for each measure, and in that sense could be considered objective. This method is applied for the system designer in [Tab. 5] (SysDes ratings for functionality, schedule, and project process). However, this approach introduces significant inaccuracies. Stakeholders who do not care about a particular criterion might be allowed to omit assessing scores for omitted criteria, because they implicitly would give these criteria an importance weight of 0. Assuming that the systems designer has no interest in project cost or in training impact, and that the user and user manager have no concern with project process, the table of final value functions for scores by stakeholders might be as given in [Tab. 5]. 4.6 Assess Relative Criteria Weights by Each StakeholderFour different ways to assess relative weights were considered: Direct subjective evaluation, SMART [Edwards, 1994], Ratio pairwise comparison [Saaty, 1977], and a geometric progression. The exercise showed that uncertainty direct subjective evaluation. Case 1: Direct subjective evaluation. The user may allocate weights directly (subjective evaluation, as in the User row of [Tab. 6]). The user was indifferent with respect to the project process, and therefore gave that criterion a weight of 0. The greatest emphasis was assigned to functionality, assigned a weight of 0.6. Time was considered the next most important item, but much less important than functionality. Cost and Training were equally important to the user. The user's entries are given in [Tab. 6]. Case 2: The SMART method. A second way to allocate weights would be to assign the least important criterion a value of 1, and assign relative weights representing multiples of importance for each of the other criteria (swing weighting [Edwards 1994]). For instance, the user's manager might consider project process as the least important to him, with a relative weight of 1. Relative weights of 2 might be assigned to functionality and to training, 3 to time, and 4 to cost. Standardized weights are obtained by summing the assigned relative weights and then dividing each by the total sum. The resulting sum of weights adds to 1.0. This approach is reflected in manager's entries within [Tab. 6]. Page 316 Case 3: Ratio pairwise comparison. The project manager may give the following ratios of relative importance of each column to the row entry:
The project manager holds that functionality is only 1/2 as important as cost or training, but twice as important as time, and four times as important as process. The complete matrix is generated by inversion of corresponding entries, yielding:
The eigen vector for this matrix yields the [Tab. 6] weights for the Project Manager. The eigen vector is obtained by identifying the characteristic function of the matrix, as explained in [Saaty, 77]. Case 4: Geometric progression. The system designer utilizes the geometric progression approach for weights as used earlier to generate scores over criteria. Criteria are ranked. Then the least important criterion is assigned 1 (Wa=1), the next most important 2 (Wb=2), the next 4 (Wc=4), and so on. Then each assigned value is divided by the sum (Wa+Wb+Wc=1). Stakeholder weights would therefore be shown in [Tab. 6].
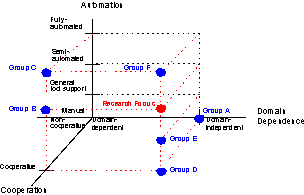
Table 6: Relative weights 4.7 Rank OptionsThe values in [Tab. 7] are obtained by multiplying the weights for each criterion by the score of each option on that criterion by individual stakeholder. For instance, the user's set of weights times scores for Option 1 would be the overall value of Option 1 to the User, i.e.: Page 317 0.6x1.0 + 0.1x0.8 + 0.2x0.2 + 0.1x0.5 = 0.770 These scores can then be used to rank in order the options being considered. This yields the rankings given in [Tab. 7]. Table 7: Rankings by individual stakeholder The stakeholders will often have different rankings. Evaluation of why these rankings are different is made possible with the multi-criteria model. This is then the starting point to conflict resolution. The user ranked A2 third. That is because the user was most concerned with functionality (weight 0.6), and the user rated this alternative low on functionality (score 0.5). The system designer also ranked A2 third, and the system designer ranked A2 as the lowest alternative on functionality (0.12). These assessments of functionality differ from those of the manager (0.9) and the project manager (0.8). It is quite possible that the same criterion can be viewed from different perspectives, resulting in cases such as that encountered here. Examination of the ratings of the systems designer indicate that on all three criteria considered, the systems designer had a preference for A4, the system involving the least difficulties in implementation. Weights for the group could come from the same variety of sources implied in the discussion earlier. Since the user's manager is the official responsible, we began with his weights. The group assessments implied are in [Tab. 8]. Table 8: Group aggregated assessments Again, the aggregate result yields option A2 as preferred. When a level of congruence such as this arises, the group might be satisfied that it has identified the preferred choice. The current solution is a simple, secure system. It is the least expensive alternative with a relatively short expected development time. At this stage, the group might focus on revising a design to better meet individual win conditions. Page 318 Here, all four of the methods yield option A2, the simpler, secure system. There are myriad other ways of reaching reconciliation as well. In addition, the benefit of analysis is greater if the reasons for different rankings are identified. 4.8 Post-Analysis (Tradeoff, Sensitivity Analysis) for Reaching AgreementIn our example the user will not receive maximum functionality. Any particular functionality features deemed important enough to merit project modification can be identified at this time. If automatic hyperlink management is not present in A2, but is considered mandatory, option A2 can be modified to include this particular feature, with corresponding adjustments to cost and time. Other full functionality features that the current option may not have, such as automatic full-text editing, may be deemed not worth the added cost and schedule impact, and could be another source of alternative improvement in terms of stakeholder preferences. 5 Lessons Learned and Further Research ChallengesThe MPARN approach offers useful tools to aid the stakeholder negotiation process. However, there are a number of challenges involved in its process. These challenges are given briefly here due to lack of space, but provide a great deal of fruitful scope for future research. 5.1 Option Generation and Negotiation PlanningAn important issue is how to sort these conflicts (shown in Step 2) to aid in generation of options (shown in Step 3) reflecting the win conditions of the different stakeholders. We would not want to generate options satisfying each combination of conditions, because that would be intractable (at a minimum, the number of binary combinations would be 2n combinations, e.g. 256 options for n=8). We would recommend reviewing the conflicts to identify a small set of alternative designs (10 would represent a thorough set of designs) intended to represent different sides of the conflicting issues. One device that might simplify this process would be cross-impact (or dependency) analysis, which would identify clusters of stakeholder positions. An ideal solution for each cluster could be used as the basis of a design. This would imply the need to consider the entire set of criteria. 5.2 Criteria ExplorationExploring and agreeing criteria among stakeholders are challenging problems. Criteria were generated in Step 4 by reviewing and combining the set of win conditions. The generation of this list would be prior to consideration of conflicts. If different stakeholders held different views on the same issue (such as the user and the systems developer in our example with respect to format support), criteria representing both positions could be included. An initial, complete list of criteria can be generated first. This long list of micro-criteria can then be reviewed and grouped by theme, yielding the macro-criteria. In our example, we ended up with five such macro-criteria, which were used as the focus of the multi-criteria analysis for which scores over alternatives were assessed. Two of these macro-criteria (functionality and project process impact) consisted of micro-criteria. The identification of the macro-criteria is usually a natural grouping of micro-criteria representing a common theme. Page 319 5.3 Objective Assessment for Option Score and Criteria WeightIt is preferable to be objective because decisions then would be based on concrete facts, rather than human opinion, which we all recognize as highly variable across individuals. It is harder to justify a decision when it is based on subjective judgment. However, it is not always possible to base preference analysis on totally objective input. The selection of an effective assessment method for a specific situation among the proposed methods shown in Step 5 and 6 would be an interesting and important topic in near future. 5.4 Systematic Post-Analysis for AgreementReaching agreement is a difficult task. One way to accomplish agreement is to let the responsible manager make the decision. Use of a group support system lets all stakeholders have an opportunity to provide their input. This alleviates some of the apparent arbitrariness usually perceived in dictatorial decisions. At the opposite extreme, the decision could be made by voting. As in political decision-making, this does not guarantee complete acceptance. Quite the contrary, all of the mechanisms that have been applied to reaching a decision can be applied in the proposed system. The opportunity to express win conditions, the use of group support systems to thoroughly review expected impact, and the use of multi-criteria analysis to systematically design improved alternatives, will provide a decision environment gaining broader support from participating stakeholders 5.5 Graphical SupportA further area of research interest is multiple criteria visual support. A number of multiple criteria methods exist [Olson, 1996]. Some of these have graphical support, in the form of demonstrating the impact of changes in weights of criteria, as well as comprehensive sensitivity analysis. The effectiveness of these various forms of graphical support to groups would be of interest. Another area meriting further research would focus on the presence of multiple stakeholders in each role, such as a users committee. 6 Related WorkThere are various conflict resolution techniques. They can be broken down by their degree of cooperation, domain dependence, and automation [see Fig. 2]. The degree of cooperation encompasses non-cooperative theories such as zero-sum game theory as well as very cooperative ones such as Theory W [Boehm, 1989]. The degree of domain dependency can range from specific knowledge for applying a domain, i.e., domain dependent, to common knowledge for applying multiple domains, i.e., domain independent. The degree of automation is a characteristic relevant to support tools for the various conflict resolution techniques. These tools can be fully automated, partially automated, general, or manual. [Tab. 9] shows the conflict resolution techniques grouped by their aforementioned attributes. Page 320 Figure 2: Classification of conflict resolution techniques The focus of the MPARN model is cooperative, domain independent, and semi-automatic (Group G) because Group G has relative advantages in light-weighted assessment (more scalable) relative to fully-automatic approaches (Group C or F), has a more systematic approach to stakeholder negotiation than does manual or general tool support approaches, e.g., Group A, D, or E, and is more broadly applicable to domains than domain-dependent approaches, e.g., Group B or C. In addition, the MPARN model enables stakeholders to assess quantitatively preferences of each alternative (conflict-resolution option) per stakeholders and understand who and how much they prefer each alternative to help resolve requirements conflicts, where other approaches in Group G use qualititive assessment techniques. [Fig. 3] maps scalability against the degree of automation. The scalability is low in fully automated and manual systems, medium in general systems, and high in semi-automated systems because the total workload is high in fully automated and manual systems, medium in general systems, and low in semi-automated systems. The total workload is determined by the combination of human-processing workload and computer-processing workload. Computer-processing workload includes interpreting, reasoning, and generating facts and rules in the system's knowledge base. Semi-automated systems have the best scalability because human-processing workload increases sharply from semi-automated to manual systems and computer-processing workload increases sharply from semi-automated to fully automated systems. The accuracy of the results depends on the degree of automation. If project personnel are experts in an application domain, high accuracy can be achieved even with manual systems which have no computerized aids. Fully automated systems provide high accuracy, i.e., good, in the results when the formalized knowledge and reasoning algorithms are accurate. Semi-automated systems (such as MPARN) provide medium, i.e., reasonable, accuracy of initial drafts suggested by the systems, but they provide high accuracy, i.e., good, in the results, where project personnel first filter the initial drafts suggested by the systems. Page 321
Table 9: Conflict resolution techniques Figure 3: Workload per the degree of automation Page 322 7 ConclusionsRequirements analysis is a key element of information system and information technology projects. Group support systems provide a very useful means for users, developers, managers, owners, maintainers, and other interested parties to have a say in the design of system solutions. Semi-automated approaches like WinWin provide a means to design superior systems. This paper proposes the use of preference function analysis to more effectively assess conflicts, and lead to selection of a superior systems design alternative by adapting the WinWin requirements negotiation framework. The MPARN model was applied to an industrial-academic repository system. The MPARN uses preference function methodology developed within the multiple criteria decision-making field to more accurately and systematically measure individual preferences and value functions. Such measures would be expected to be inaccurate in a confrontational environment where strategic gaming behaviour was adopted. Nonetheless, in a cooperative environment, where all group members were interested in generating a winning solution for everyone, accurate measures could be expected. Acknowledgements This work is partially supported by a Korea University grant. We would like to thank Drs. Barry Boehm and Tom Rodgers for sharing experimental data and having useful discussion on this topic. This paper was significantly extended from a conference paper published at COMPSAC [In, 2002]. References[Barbacci, 1997] Barbacci, M., Carriere, J., Kazman, R., Klein, M., Lipson, H., Longstaff, T., and Weinstock, C. (1997). Steps in an Architecture Tradeoff Analysis Method: Quality Attribute Models and Analysis. CMU/SEI Technical Report, CMU/SEI-97-TR-29 ADA188100, Software Engineering Institute, Carnegie Mellon University, Pittsburgh, PA. [Bell, 1988] Bell, E.D., Raiffa, H., and Tversky, A. (1998). Decision making: Descriptive, normative, and prescriptive interactions. Cambridge University Press. [Boehm, 1989] Boehm, B. and Ross R. (1989). Theory W Software Project Management: Principles and Examples. IEEE Transactions on Software Engineering, 15(7): 902-916. [Boehm, 1994] Boehm, B., Bose, P., Horowitz, E., and Lee, M. (1994). Software Requirements as Negotiated Win Conditions. Proc. ICRE'94, pages 74-83. IEEE Computer Society Press. [Boehm, 1995] Boehm, B., Bose, P., Horowtiz, E., and Lee, M. (1995). Software Requirements Negotiation and Renegotiation Aids: A Theory-W Based Spiral Approach. Proc. ICSE'95, IEEE Computer Society Press, Seattle. [Boehm, 1996a] Boehm, B. and In, H. (1996). Identifying Quality-Requirement Conflicts. IEEE Software, 13(2): 25-35. [Boehm, 1996b] Boehm, B. and In, H. (1996). Software Cost Option Strategy Tool (S-COST). (1996). Proc. COMPSAC'96, pages 15-20. IEEE Computer Society Press, Seoul, Korea. [Boehm, 1998] Boehm, B. and In, H. (1998). Conflict Analysis and Negotiation Aids for Cost-Quality Requirements. Software Quality Professional (SQP), American Society for Quality (ASQ), 1 (2): 38-50. Page 323 [Boehm, 1999] Boehm, B., Egyed, A., Port, D., Shah, A., Kwan, J., and Madachy, R. (1999). A Stakeholder Win-Win Approach to Software Engineering Education. Annals of Software Engineering. [Conklin, 1988] Conklin, J. and Begeman, M. (1988). gIBIS: A Hypertext Tool for Exploratory Plicy Discussion. ACM Transactions on Office Information Systems, 6: 303-331. [Choo, 1999] Choo, E.U., Schoner, B., and Wedley, W.C. (1999). Interpretation of Criteria Weights in Multicriteria Decision Making. Computers and Industrial Engineering, 37: 527-541. [Chung, 1995] Chung, L., Nixon, B., and Yu, E. (1995). Using Non-Functional Requirements to Systematically Support Change. Proc. ICRE'95, pages 132-139. IEEE Computer Society Press. [Dyer, 1979] Dyer, J.S. and Sarin, R.K. (1979). Measurable Multiattribute Value Functions. Operations Research, 27: 810-822. [Easterbrook, 1991] Easterbrook, S. (1991): Handling conflict between domain descriptions with computer-supported negotiation. Knowledge Acquisition, 255-289. [Edwards, 1994] Edwards, W. and Barron, F.H. (1994). SMARTS and SMARTER: Improved Simple Methods for Multiattribute Utility Measurement. Organizational Behavior and Human Decision Processes, 60: 306-325. [Gilb, 1988] Gilb, T. (1988). Principles of Software Engineering Management. Addison-Wesley. [Gruenbacher, 2001] Gruenbacher, P. and Briggs, R.O. (2001). Surfacing Tacit Knowledge in Requirements Negotiation: Experiences Using EasyWinWin. Proc. HICSS'01 (Hawaii International Conference on System Sciences). [In, 2001] In, H., Boehm, B., Rodgers, T., and Deutsch, M. (2001). Applying WinWin to Quality Requirements: A Case Study. Proc. ICSE'01, pages 555-564. IEEE Computer Society Press, Toronto. [In, 2002] In, H., Olson, D., and Rodgers, T. (2002). Multi-Criteria Preference Analysis for Systematic Requirements Negotiation. Proc. COMPSAC'02, pages 887-892. IEEE Computer Society Press, Oxford. [Jones, 1980] Jones, A.J. (1980). Game Theory: mathematical models of conflict. Ellis Horwood Series, published by Ellis Horweed Limited, distributed by John Wiley & Sons. [Keeney, 1976] Keeney, R.L. and Raiffa, H. (1976). Decisions with Multiple Objectives: Preferences and Value Tradeoffs. Wiley / New York. [Kazman, 1998] Kazman, R., Klein, M., Barbacci, M., Longstaff, T., Lipson, H., and Carriere, J. (1998). The Architecture Tradeoff Analysis Method; CMU/SEI Technical Report, CMU/SEI-98-TR-008 and ESC-TR-98-008, Software Engineering Institute, Carnegie Mellon University, Pittsburgh, PA. [Klein, 1991] Klein, M. (1991). Supporting Conflict Resolution in Cooperative Design Systems. IEEE Transactions on Systems, Man, and Cybernetics, 21(6): 1379-1390. [Klein, 1996] Klein, M. (1996). Core services for coordination in concurrent engineering. Computers in Industry, 29: 105-115. [Lamsweerde, 1998] Lamsweerde, A., Barimont, R., Letier, E. (1998). Managing Conflicts in Goal-Driven Requirements Engineering. IEEE Transactions on Software Engineering, 24(11): 908-926. [Lee, 1990] Lee, J.: SIBYL: A Qualitative Decision Management System. (1990). Artificial Intelligence at MIT: Expanding Frontiers, Edited by P. Winston and S. Shellard, MIT Press, Cambridge. Page 324 [Luce, 1958] Luce, R.D. and Raiffa, H. (1958). Games and Decisions: Introduction and Critical Survey. John Wiley & Sons, Inc. [McCall, 1977] McCall, J., Richards, P., and Walters, G. (1977). Factors in Software Quality. General Electric Command & Information Systems Technical Report 77CIS02 to Rome Air Development Center, Sunnyvale, CA. [Mylopoulos, 2001] Mylopoulos, J., Chung, L., Wang, H.Q., Liao, S., Yu, E. (2001). Exploring alternatives during requirements analysis. IEEE Software, 18(1): 92-96. [Nuseibeh, 2000] Nuseibeh, B.A., Easterbrook, S. M., and Russo, A. (2000). Leveraging Inconsistency in Software Development. IEEE Computer, 33(4): 24-29. [Olson, 1996] Olson, D.L. (1996). Decision Aids for Selection Problems. Springer. New York. [Pruitt, 1981] Pruitt, D. (1981). Negotiation Behavior. Academic Press. [Ramesh, 1992a] Ramesh, B. and Dhar, V. (1992). Supporting Systems Development by Capturing Deliberations During Requirements Engineering. IEEE Transactions on Software Engineering, 18(6): 498-519. [Ramesh, 1992b] Ramesh, B. and Sengupta, K. (1992). Managing Cognitive and Mixed-motive Conflicts in Concurrent Engineering. Concurrent Engineering, 18(6): 498-519. [Robinson, 1994] Robinson, W.N., and Fickas, S. (1994). Automated Support for Requirements Negotiation. Proc. AAAI-94 Workshop on Models of Conflict Management in Cooperative Problem Solving, pages 90-96. [Ruiz, 2001] Ruiz-Cortes, A., Duran, A., Corchuelo, R., and Toro, M. (2001). Automated support for Quality Requirements in Web-services-based systems. Proc. FTDCS'2001, pages 48-55. IEEE Computer Society Press. Bologna, Italy. [Saaty, 1977] Saaty, T.L. (1977). A Scaling Method for Priorities in Hierarchical Structures. Journal of Mathematical Psychology, 15: 234-281. [Sriram, 1992] Sriram, D., Logcher, R., Groleau, N., and Cherneff, J. (1992). DICE: An Object-Oriented Programming Environment for Cooperative Engineering Design. Artificial Intelligence in Engineering Design, Vol. III, Tong, C. and Sriram, D., eds., Academic Press: 303-366. [Sriram, 1993] Sriram, D. and Logcher, R. (1993). The MIT Dice Project. Computer 26(1): 64-65. [Sycara, 1991] Sycara, K. (1991). Problem Restructuring in Negotiations. Management Science, 37(10):1248-1268. Page 325 |
||||||||||||||||||||||||||||||||||||||||||||||||||||||||||||||||||||||||||||||||||||||||||||||||||||||||||||||||||||||||||||||||||||||||||||||||||||||||||||||||||||||||||||||||||||||||||||||||||||||