| Submission Procedure |
An Example of Task Oriented Empirical Evaluations of 3D-Display ModesSabine Volbracht Gitta Domik Khatoun Shahrbabaki Gregor Fels Abstract: The increasing availability of 3D input and output devices demands a better understan ding and comparison of their quality. This paper describes an empirical experiment that provides quantitative results of the viewing quality of stereoscopic and perspective display modes. In this study such results accuracy and time of eightyone users were measured performing realistic 3D tasks to research the structures of organic molecules. A subsequent comparison of cost vs. performance can represent a meaningful help for decision-making of users and designers. The experiment was designed and conducted in cooperation of computer and chemical scientists. The experience of both sides was necessary to get a controlled testing environment with appropriate tasks. The considered display modes were perspective mode, anaglyph mode and shutter glass stereo mode. Additionally the effect of the level of expertise of a subject on accuracy and response time were explored. Mean response errors and mean response times were computed separately by a two-way analyses (ANOVA) for a series of six tasks and eighty-one subjects. Key Words: output devices, 3D, display mode, empirical evaluation, stereo perception 1 IntroductionOver the past few years, 3D graphics has received a great deal of attention and is widely acknowledged as a challenge in Scientific Visualization [Rosenblum 94], Computer Graphics, HCI [Wanger, Ferwerda and Greenberg 92], VL [Ware and Franck 94], and many other areas. 3D graphics as a meaningful visualization of data must fit syntax and semantics of these data, support the visualization goals (task), conform to the problem domain, adapt to the user as well as be adequately supported by available computer resources, Page 534 which determine visualization techniques and display modes [Domik and Gutkauf 94]. An important aspect of three-dimensional visualization is the observer's perception of depth. Against the many depth attributes to provide a sense of depth such as fading brightness, perspective geometry, occlusion, transparency, change of brightness and ro tation/'rocking' there is another interesting depth cue: stereopsis. Former developments in computer technology have led to an increasing interest of stereo techniques. Ne vertheless these techniques require different capital expenditures in soft- and hardware, and traditional visualization tools without any stereo technique are used in many areas of science and technology. Consequently it is an interesting issue if stereo effects pro vide more expressiveness and effectiveness in comparison to the traditional display techniques and what kind of display mode is adequate for a particular user. In this context it is necessary to consider the everyday working environment and tasks of the user to understand the goals which are associated with the use of certain I/O-tech nologies. This understanding is important, because different tasks and goals make dif ferent demands on I/O-devices. For example, an architectural walkthrough, obviously requires an immersive display, whereas other tasks such as the examination of an object in a CAD-system, may not improve by the use of an expensive immersive display. It can be said, that a technology improves a task and is therefore adequate for a user when the user can achieve the aspired goals through its use. But in most cases it isn't obvious what kind of task requires what kind of display mode. This aspect and the aspect of cost limitations for the user show, that task oriented evaluations of I/O-technologies associa ted with defined application areas are needed to provide controlled testing environ ments for getting quantitative comparisons, which in turn are meaningful for the decision-making of a potential buyer. These considerations have led to the motivation of the following experiment. The ex periment was designed in cooperation with an expert in organic chemistry. The every-day working environment of an organic chemist includes computer screens and 2d-mice as traditional I/O-devices using perspective display modes. The general goal of an or ganic chemist by using chemical 3D-visualization systems is to get spatial information about molecule structures in a fast and accurate way. Therefore we have chosen two ste reoscopic display modes anaglyph stereo and shutter glass stereo mode to compare with the currently widely used perspective viewing mode. In our experiment we measu red accuracy and time during the performance of certain tasks. To understand the influ ence of the experience level with organic molecules on our test results, we used subjects with different educational background. The tasks were taken from true research pro blems in organic chemistry. As visualization technique we have chosen the stick-model (see Figure 1). The stick model was preferred by our chemists over (Kalotten) or balland-stick models, because of its power to show overall 3D structure. However, lack of depth cues in comparison to the alternatives makes the stick-model a challenge for 3D viewing. The three considered 3D display modes (perspective viewing, anaglyph stereo and shutter glass stereo) were implemented as following: Page 535 Perspective viewing: The molecules are projected onto a 2D plane using perspective projection and color. Anaglyph stereo: Two perspective views of the molecules are generated, a right- and a left-eye perspective view with complementary colors (red/green or red/blue). The observer uses glasses with red/ green or red/blue filters, respectively. Color can not be used for carrying information about the molecules in this mode. Shutter glass stereo: Two perspective views of the molecules are generated using the same color scale as in the perspective molecule. Here the right- and left-eye views of the molecules are presented alternately on the screen with 120 Hz (60 right-eye views and 60 left-eye views per second). The observer looks through StereoGraphics CrystalEyes® LCD shutter glasses. Main differences of this experiment to previous studies in the area of 3D technology evaluation (e.g. [Beaton and Weinman 88], [Hsu et al. 94], [Ware and Franck 94], [Ware and Franck 96]) are the choice of display modes, reducing of the testing environment to one application area (organic chemistry), inclusion of experience level in the experi ment and consideration of cost vs. performance. 2 Basic Terms of Empirical ExperimentsLet us first consider some common aspects of the motivation of using empirical expe riments. The individual reasons for choosing empirical experiments in research are dif ferent for diverse scientific areas. But all these areas have one common reason, namely establishing clear cause-and-effect relationships. A clear cause-and-effect relationship is shown when an observed effect is caused by a controlled factor, so that the researcher doesn't have to distinguish between various possibilities which could cause the effect. In the area of computer science empirical experiments are frequently used to increase user performance and consequently to enhance user satisfaction. The following explanation of basic terms [Eberts 94] [Johnson 92] are helpful for the reader to understand experimental designs. Independent Variable: ``In an experiment, independent variables are those fac tors that are systematically varied by the experimenter under controlled conditions.`` ... ``; a level is a particular value that the independent variable can take in the experiment.`` [Johnson 92] Dependent Variable: A dependent variable is that which is measured, e.g. re sponse time or response errors. Confounding Variable: In an experiment there can be other factors which could cause an effect on the dependent variables. These factors are known as extraneous variables which must be discounted by e.g. holding constant or absent. An extraeous Page 536 variable is called confounding variable when it affects only one of the independent variable levels and not all together. In those cases there is no clear cause-and-effect relationship, because the experimenter can not determine if the differences between conditions are due to independent or confounding variables. There are different methods to control confounding variables in an experiment. Between-Subject Design: In the between-subject design different groups of subjects are used in each condition of the experiment. So the subject contributes just one score to the data analy sis. Within-Subject Design: In the within-subject design the same group of subjects is used in all conditions of the experiment. So repeated measures are obtained from each subject. In addition to the above terms there are a lot of components which must be considered when designing an experiment, e.g. the experimenter has to formulate a research que stion, choose the experimental techniques or select the subjects. 3 The ExperimentThe following experiment was developed in cooperation with an organic chemist. The tested hypothesis, the used testing environment, the performing tasks as well as the vi sualization technique were choices which were made after strong consideration of the chemical working environment and problem domain. Before the experiment a pretest was conducted to verify the developed design to get a controlled environment. The experimental design was based on [Eberts 94] and [Conte, Donsmore and Shen 86]. Now the experiment will be described in detail. 3.1 Research hypothesisThe research hypothese to be tested were:
3.2 Experimental designThe independent ('display mode' and 'experience') and dependent ('accuracy' and 'time') variables were defined by the research hypothesis. Consequently the design of the experiment was a 3x3 factorial experiment with three classes of 'display mode' Page 537 (perspective viewing, anaglyph stereo and shutter glass stereo) and three levels of 'experience' (high, low, none experience). This has led to 9 experimental conditions. Beside the above variables there were some confounding variables which had to be con trolled. The expertise level could be a confounding variable. Because experience was important to the results of the experiment it was made to be an independent variable. Most of the following confounding variables were controlled by holding them constant in one of two ways: either all subjects in all groups were treated exactly the same or subjects were randomly assigned to groups. Some of the confounding variables were:
Other possible confounds such as, 'Increasing improvement of the subject during the course of the experiment' were controlled by varying the order of the tasks and the considered display modes. Additionally each task was combined with another molecule. In this way we avoided subjects remembering the structure of molecules (`carryover effect`). 3.3 The tasksThe following tasks had to be performed by the subjects.
These tasks reflect three problems an organic chemist (using 3D computer graphics pro gram) has in his/her work: the problem of identifying objects, comparing objects and positioning of an object. In all cases objects were atoms, rings or other chemical struc tures in a molecule. Comparing was referred to the comparison of distances. Page 538 Identifying and comparing were each tested with a simple and a complex molecule to understand the relationship between complexity and viewing. But in this context we could only show a tendency, because the complexity of the molecules wasn't an inde pendent variable. Two variations of complexity are not enough for showing significant differences, but they can`t did show a tendency. Additionally another identification task without interaction was considered. The particularity of this was the absence of hidden relevant objects. That means the difference between the first two identifying tasks and the last one is the importance of depth information for identifying. For the first two tasks the depth information was very important for identifying rings, because the molecules could not be positioned in a way that all rings could be seen clearly at the same time. Some rings were always hidden. For the third identifying task all the relevant rings could be seen clearly in the initial position. So rotating was not necessary.
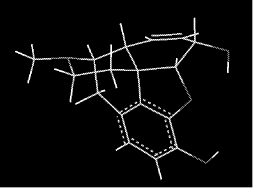
Figure 1: Simple molecule used to answer T1: Count the rings in the molecule. The experiment involved 81 participants. The subjects were students of Chemistry or Computer Science. The students of Chemistry were divided into two groups. Students of the first group were specialized in organic chemistry, so they had high experience in viewing 3D representations of organic molecules. Students of the other group were specialized in other areas of chemistry so they had only low experience in viewing 3D molecules. The third group consisted of students of Computer Science which had no experience with any kind of molecules. One of the confounding variables given above which had to be controlled was, that a subject was not allowed to perform the same task in all three display modes, because the subject would know the special molecule of this task in the next mode. So a counterbalancing procedure was necessary to distribute the six tasks among different sub jects and three display modes. Table 1 shows the chosen procedure for three subjects.Table 1 shows that subject 1 for example has to perform only task one and two in the perspective mode, whereas subject 2 performs task one and two in the anaglyph mode and subject 3 in the shutter glass mode. The distribution of the other tasks are analog the first two. This procedure was repeated nine times for each group with different expertise level and 27 times for the whole experiment. This repetition of the above pro cedure has effected a between-subject design for each task. Page 539
Table 1: Counterbalancing procedure for the six tasks T1, ..., T6 Therefore there were 81 measurements of time and errors from 81 different subjects for each task. Table 2 shows the distribution of the 81 measurements among the nine experimental conditions.
Table 2: Number of measurements for each experimental condition 3. 4 ProcedureBefore beginning the experiment and before each task, the subjects received practice time for a few minutes to become proficient with each 3D display mode and familiar with the particular molecule. The tasks could performed interactively on each of the 3D display modes. The interaction was restricted to molecule rotations with the mouse. An objective comparison was based on the correct answers of the tasks and measured time for answering. Once the subject pressed a 'Start/Ready' button, the interviewer explained the task, so the subject didn't have to write or to read during the session. After performing the task, the subject pressed the 'Start/Ready' button again to indicate the end of the trial. At that time the response time and other necessary information were recorded. The experiment was conducted in a chemical office room. The computer used to produce the display modes was an Indigo 2 , R4400/150 with 'Extreme Graphic' of SiliconGraphics® and a 21' monitor with stereo ability. The additional equipment used for the stereo modes consisted of StereoGraphics CrystalEyes® LCD shutter glasses and glas ses with red/green or red/blue filters for the anaglyph mode. 4 The ResultsBecause of the two independent variables a two-way Analysis of Variance (ANOVA) with 9 experimental conditions consisting of the factorial combination of three classes of display mode (perspective viewing, anaglyph stereo and shutter glass stereo) and Page 540 three levels of experience (high, low and none) were used for each task.
Thereby mean response errors and mean response times were computed separately.
Following a Newman-Keuls test ( Table 3 and 4 summarize the main effect of display mode for all tasks, averaged over 27 subjects and three experience levels. In both cases (response errors and times) in teraction effects were not significant.
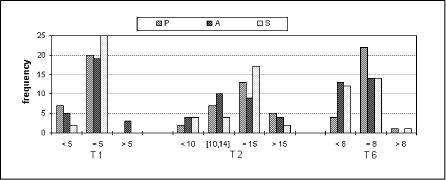
Table 3: Main effect of display mode (mean response error) Error values are expressed as follows: T1 (rings): Difference to the correct number of rings.The correct answer was 5 rings.
So the greatest error behaved on 15.48 angstroms (computed from 6! possibilities). T5 (angle): Error angle in degrees. T6 (rings): Difference to the correct number of rings. The correct answer was 8 rings. Page 541
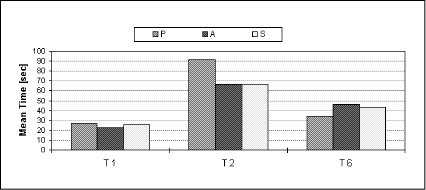
Table 4: Main effect of display mode (mean response time) In the following discussion the degrees of freedom associated with all F-ratio are 2 and 72. So we will replace the usual notation 'F(2,72) =' by 'F='. 4.1 Identifying tasksAn interesting result was that for T1 significant differences between the three modes occurred neither in the amount of errors nor in the measured response time, but rather in experience levels for response time (F = 5.35, p = 0.0068). A Newman-Keuls test in dicated that Chemistry students specializing in organic chemistry were faster in iden tifying rings than students of Computer Science. The difference was strongly significant.
Figure 2: Frequencies of answers by display mode for P (perspective), A (anaglyph) and S (shutter glasses), averaged over 27 subjects and 3 experience levels, by response error. The correct answers are represented by the underlined numbers. In T2, where the molecule was more complex, the main effect of display mode was si gnificant for response error (F = 3.43, p = 0.038) and for response time (F = 5.35, p = 0.0068). The results of a Newman-Keuls test showed that identifying in shutter and ana glyph mode was better than in perspective mode. The main effect of experience (F = 4.55, p = 0.014) had significant differences in response errors. A comparison of the experience levels proved that students with more experience in organics scored better than the other groups. Page 542
Figure 3: Main effect of display mode for P (perspective), A (anaglyph) and S (shutter glasses), averaged over 27 subjects and 3 experience levels, on response time. An unexpected result was that perspective viewing makes it easier to count bezene rings as long as the information was not hidden (T6: response error: F = 4.33, p = 0.017; re sponse time: F = 4.78, p = 0.011). An explanation may be, that if third dimension doesn't provide any necessary information was not hidden (T6: response error: F = 4.33, p = 0.017; response time: F = 4.78, p = 0.011). An explanation may be, that if third dimension doesn't provide any necessary information it made the interpretation of the visualization more difficult. We presume that in such a case a redundant visual cue de creases the effectiveness of a visualization. However, perspective viewing is often not reliable, because information might be hidden. 4.2 Comparison tasks
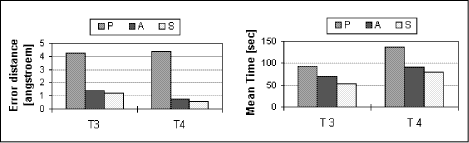
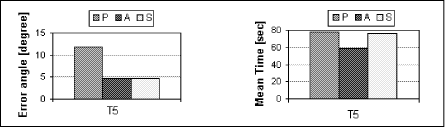
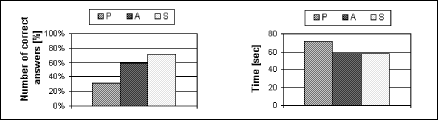
Figure 4: Main effect of display mode on response error and time for P (perspective), A (anaglyph) and S (shutter glasses), averaged over 27 subjects and 3 experience levels. As shown in Figure 4, the main effects of display mode for T3 (response error: F = 21.65, p < 0.0001; response time: F = 12.54, p < 0.0001) indicates that comparison of small objects was considerably better in mean errors and times for shutter and anaglyph mode than for perspective mode. Nevertheless in shutter mode the mean time was si gnificant lower than in the anaglyph mode. So the results show that comparison of small objects was better in shutter mode than in the other modes. By comparison of larger objects Page 543 (T4: response error: F = 18.80, p < 0.0001; response time: F = 14.47, p < 0.0001) a Newman-Keuls test indicated that the differences of shutter and anaglyph mode were not significant. The test showed as well that the differences in mean errors and times between the stereo modes and perspective mode were strongly significant. 4.3 Positioning tasksAnother interesting outcome were the results of T5 (response error: F = 16.09, p < 0.0001; response time: F = 4.7 8, p = 0.011). The analysis of the obtained data showed that positioning errors were considerably smaller in anaglyph and shutter mode than in perspective mode but the position time was only significantly better in anaglyph mode. The difference in mean time of shutter and perspective mode was not significant.
Figure 5: Main effect of display mode on response error and time for P (perspective), A (anaglyph) and S (shutter glasses), averaged over 27 subjects and 3 experience levels. 5 Comparison of Cost vs. PerformanceA comparison of cost vs. performance of I/O-technologies is important for users as well as for designers of hard- and software. Such comparisons could help users in their de cision-making by finding out their adequate technology. Designers could use them also for increasing usability. In this case the experiment provided an interesting outcome. By computing the accuracy as summary of correct answers from the five tasks T1 to T5 (tasks with relevant depth information) and the needed time as mean response time of the correct answers, the performance could be computed as accuracy over time. Figure 6 shows separately the accuracy and the mean response time.
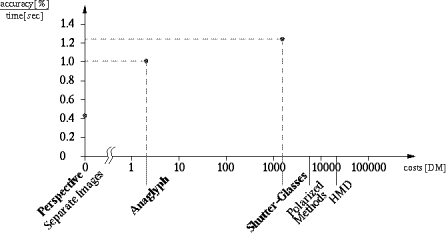
Figure 6: Summary of correct answers from T1 to T5 and associated mean response time for P (perspective), A (anaglyph) and S (shutter glasses). 100% is correlated with 135 (=5 x 27) correct answers with a low tolerance of errors. Page 544 The following comparison of cost vs. performance (Figure 7) of the three here discussed 3D display modes would therefore favor anaglyph stereo. The reader should note that the main disadvantage of anaglyph stereo, namely the lack of color attributes, is not considered in this comparison. Though organic chemists prefer the use of color dis plays, their critical viewing tasks did not - to their own surprise - demand the use of co lor. An important aspect for the stereo mode is the wearing of glasses. It could be an an noyance factor for the user by solving simple problems. But wearing red/green glasses or shutter glasses is not as annoying as wearing e.g. a head-mounted display. And the present research of 3D output devices promises a development of devices without ad ditionally wearing of equipment. Here the user has to decide what kind of display tec nology is adequate for the everyday working environment.
Figure 7: Cost vs. performance for perspective mode, anaglyph mode and shutter glass mode on a logarithmic scale of cost (Dec. 1996) 6 Conclusions and Future WorkAs expected, viewing in the shutter glass stereo mode provided faster and more accurate results in our experiment than the perspective viewing. But a very interesting outcome was that viewing in the anaglyph mode shows a strong resemblance to the quality of shutter mode. Our experiment also demonstrated that user experience is relevant only for identifying special objects. No indication was given that level of experience with special objects changed the results on comparing or positioning tasks. Finally, a tendency of the relationship between complexity and viewing is that by incre asing complexity the differences in accuracy and time between the perspective mode and the two stereo modes also increases. We expect visualization techniques similar to stick models but of other application areas, Page 545 e.g. flow charts or networks, to obtain similar results. Future work will center around the comparison of other technologies such as head-mounted displays or polarized methods. Another step is the comparison of input devices correlated with the display technologies. References[Beaton and Weinman 88] Beaton, R. J., Weiman, N.: ``User evaluation of cursor positioning devices for 3D display workstations``; Three-Dimensional Imaging and Remote Sensing Imaging, Proc. SPIE. 902, (1988), 53-58. [Conte, Donsmore and Shen 86] Conte, S. D., Donsmore, H. E., Shen, V. Y.: ``Software enginee ring metrics and models``; Benjamin/Cummings Publishing Company Inc., (1986). [Domik and Gutkauf 94] Domik, G., Gutkauf, B.: ``User modeling for adaptive visualization systems``; Proc. of the IEEE Conference Visualization (1994), 217-223. [Eberts 94] Eberts, R. E.: ``User Interface Design``; Prentice-Hall, Inc., (1994). [Hsu et al. 94] Hsu, J., Pizlo, Z., Chelberg, C. M., Delp, E. J.: Design of Studies to Test the Effectiveness of Stereo Imaging Truth or Dare: Is Stereo Viewing Really Better?``; Stereoscopic Displays and Virtuel Reality Systems, Proc. SPIE, 2177, (1994), 211-222. [Johnson 92] Johnson, P.: ``Human-Computer Interaction. Psychology, Task Analyses and Soft-ware Engineering.`` McGraw-Hill Book Company, London, (1992). [Rosenblum 94] Rosenblum, L. J. (ed.): Research Issues in Scientific Visualization; ``Scientific Visualization``; Rosenblum et al; Academic Press, (1994). [Wanger, Ferwerda and Greenberg 92] Wanger L. R., Ferwerda, J. A., Greenberg, D. P.: ``Perceiving Spatial Relationships in Computer-generated Images``; IEEE Computer Graphics & Applications, May , (1992), 44-58. [Ware and Franck 94] Ware, C., Franck, G.: ``Viewing a Graph in a Virtual Reality Display is Three Times as Good as a 2d Diagram``; Proc. IEEE Symposium on Visual Languages, (1994). [Ware and Franck 96] Ware, C., Franck, G.: ``Evaluating Stereo and Motion Cues for Visuali zing Information Nets in Three Dimensions``; ACM Transactions on Graphics, 15, 2, (1996), 121-140. [Winer 71] Winer, B. J.: Statistical Principles in Experimental Design. (second Edition). McGraw-Hill, New York, (1971). Acknowledgement We thank all participants of our experiment. This research was partly sponsored by the Ministerium für Wissenschaft und Forschung in Nordrhein-Westfalen and SAP AG. Page 546
|
||||||||||||||||||||||||||||||||||||||||||||||||||||||||||||||||||||||||||||||||||||||||||||||||||||||||||||||||||||||||||||||||||||||||||||||||
 = 0.05) was applied for comparing the
different mean times and errors [
= 0.05) was applied for comparing the
different mean times and errors [ d...
d... ABS(zdisti-zdistj) with i > j and 1
  i, j
i, j