| Submission Procedure |
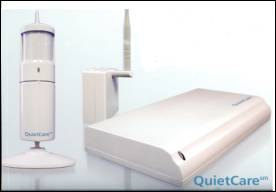
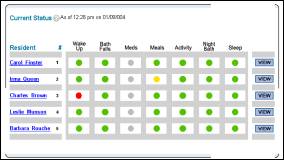
The Impact of Behavioral Monitoring Technology on the Provision of Health Care in the HomeAnthony P. Glascock David M. Kutzik Abstract: The lack of appropriate and accurate information on the ability of a frail individual to accomplish specific task oriented activities can place the individual at risk or result in the allocation of costly and unnecessary care. Although there have been previous attempts to use computer technology to obtain this information, they have proved to be costly and complex and therefore not widely used. However, a behavioral monitoring technology, based on smart-home and telemedicine applications, has been developed that obtains more accurate and timely information on the ability of frail individuals to accomplish specific tasks in their own residences than any other existing method. During a twelve month pilot study, this system has been used by care providers to assess the status of their clients, respond to immediate needs and alter overall care plans, thus resulting in better care and greater peace of mind for the individual. Keywords: Smart-home technology, Telemedicine, Behavioral monitoring, Care provision, Web-based services Categories: J.3 J.4, K.4.1, K.4.2 1 IntroductionThe goal of all care for the frail elderly, whether provided formally by professionals or informally by family members, is the delivery of the appropriate intervention, by the appropriate person, at the appropriate time. To achieve this goal, a clear and accurate knowledge of a person's performance of functional tasks in their home environment is absolutely necessary. The objective of health informatics, in particular pervasive computing, is to find innovative means of applying technology in order to extend health care beyond the conventional clinical setting to the individual in their own residence within the community. Thus, there appears to be a convergence of these two goals: to use the technological advances associated with pervasive computing to assess changes in the functional abilities of frail older people in their own homes in order to enhance their wellbeing by providing needed services in a timely manner. We report on one such attempt to use recent breakthroughs in smart-home technology and the Internet to provide vital and timely information to health care providers as part of a comprehensive home care delivery model. The technology developed is an automated behavioral monitoring system (ABMS) that makes use of five motion detectors and a base station, connected via the Internet, to a website that processes the sensor data and converts them to behavioral information that is then displayed with graphics and text for caregivers. Page 59 The system has been specifically designed to obtain a clear and accurate knowledge of a person's performance of functional tasks in the home environment. Within gerontology these functional tasks are termed Activities of Daily Living (ADLS) and Instrumental Activities of Daily Living (IADLS). ADLS are comprised of: bathing; dressing; using the toilet; eating; getting in or out of bed; and walking while IADLS consist of: meal preparation; managing money; grocery shopping; making a phone call; doing housework; taking medication; and doing laundry. In other word, ADLs are focused on one's personal care, e.g., being able to select clothing and dress and undress without or with assistance, while IADLs are more focused on activities that are associated with home management, e.g., being able to do laundry or housework either alone or with some assistance. Underlying the assessment of both of these sets of activities is the assumption that the inability to successfully accomplish one or more of the individual activities jeopardizes independence and wellbeing. Therefore, it is important to determine when an individual is having difficulty completing one or more activities in order that appropriate aid can be provided. Although there are several widely used ADL/IADL assessment instruments [Lawton, 1988; Kane, Kane, 1981; Fillenbaum, 2001], each includes a combination of observations and questions that ask the individual if they can successfully complete a specific task with no help, some help or not at all. These assessments are often supplemented by asking a caregiver the same questions about the subject and, rarely, by asking the subject to complete a series of actual tasks, e.g., walking around cones, opening jars. The information collected by these assessment instruments is then used to help determine whether the individual can function well enough to remain living independently and with what level of help. In addition to serious questions concerning the reliability and validity of these instruments [Wade, Collin, 1988]--how wise is it to ask an individual who is having trouble remembering things if they remember that they have forgotten to take their medication--their greatest weakness stems from the fact that the ability of elderly individuals to accomplish tasks declines over time. Consequently, individuals have to be reassessed in order to determine changes in their abilities, which raises costs as well as questions as to how often the reassessment should take place. Thus, during the 1990s it became obvious that some other method of assessing a person's performance of functional tasks had to be found, a method that increased accuracy, reliability and validity and allowed for frequent reassessments so that more timely information was available. It was during this search that attempts were made to employ various technologies in the assessment of ADLS/IADLS, ranging from computerizing the paper and pencil instruments, to placing video cameras in the residences of individuals. Even though some of these attempts did provide better information, most efforts proved either too expensive or too intrusive, or both. However, an approach that used technologies derived from home monitoring and smart home applications when combined with the Internet proved to be more successful in providing greater accuracy, and more reliable and valid information, while at the same time being cost effective and non-intrusive. This approach was automated behavioral monitoring (ABMS). Page 60 2 ABMS TechnologyThe key development issues for any system that would automatically monitor the behavior of frail older people in their own homes were its usability and acceptability by both the individuals being monitored and by their caregivers; it had to be easy to install and use, and it could not be threatening. If a system required people to change their behavior, or it required major modification of their residence or if they were fearful that the system was "big brother", it would not be accepted and widely used. Thus, eight principles comprising the overall design philosophy were developed to meet these requirements: 1) the design should be based on the needs of individuals, not on the existence of a technology; 2) it should use existing technology, nothing new should be invented, but instead off-the-shelf components used; 3) it should be invisible to the person being monitored; 4) its use should require no change in the normal behavior of the monitored individual, it should be passive rather than active; 5) the installation should require no retrofitting to the residence; 6) it should monitor objects in the environment, not the individual; 7) it should be software driven so that monitored activities could be easily added and removed as the needs of the individual changed; and 8) it should be cost-effective, similar to the cost of cable TV. In order to achieve these design principles, technological features were drawn from two main sources: smart-home and home automation technologies; and telemedicine, especially physiological process telemetry [Kutzik, Glascock, 2004]. With the development of increasingly sophisticated ubiquitous computing systems in the early part of the 21st century, it became feasible for systems to respond to very subtle actions on the part of the residents ranging from changes in gait to gestures to voice commands [Himanen, 2004; Giroux, Guertin, 2004; Chan, Campo, Esteve, 2004]. These technical improvements coupled with a growing interest in how to use smart-home technology to help frail individuals remain safe and independent has led to an emerging vision of the smart home which plays a more active role by assuming functions traditionally provided by human caregivers. Thus, the development of the ABMS drew extensively from smart-home technologies that could be programmed to remind the monitored individuals to turn off the stove, take their medication, query them if they are alright, and, if need be, call for help if there appears to be an emergency, such as a person falling down and being unable to get up. In addition, technologies associated with telemedicine and physiological process telemetry proved to be extremely compatible with the design principles underlying the ABMS. In particular, technologies developed by Japanese researchers in the 1990s for collecting data on heart rate, blood pressure, respiration, hydration and weight in the home environment proved to be quite helpful [Togawa, 1992]. This work, along with that of Alyufuku and Hiruta [Alyufuku and Hiruta, 1994] on non-obtrusive means for collecting and analyzing physiological data by embedding detectors in the home environment, adopted the same principles as the ABMS of non-intrusiveness, passivity and no change in the behavior of the monitored individual. Thus, an exercise bike becomes the means of measuring and recording a variety of physiological performance data including heart rate and calorie consumption, a bathtub becomes a means of measuring at rest heart rate and a specially equipped toilet becomes a means of analyzing urine and stool samples for possible pathological problems. This embedding of monitoring devices in the home environment and the use of everyday behaviors to provide the context of measurement anticipates several core features of the technology that eventually became the ABMS. Page 61 Finally, it was apparent from research conducted on the views of a wide range of individuals who worked with and cared for elderly individuals that any monitoring system had to be able to monitor at least eight task oriented behaviors: 1) medication adherence; 2) stove use; 3) eating; 4) overnight toileting; 5) wake up time; 6) general up-and-around; 7) bedtime and overnight sleep disturbance; and 8) bathtub use [Glascock, Kutzik 2004, In Press]. In addition, the research indicated that any effective monitoring system had to be structured in such a way that monitored activities could be easily added and/or subtracted depending on the needs of individual clients, the context in which the system was installed, and changes in the needs of the client over time. Monitoring bathtub overflow might be essential in an assisted living facility, but not necessarily in a one storey single-family dwelling. In other words, a cost effective system had to be able to "switch on" and "switch off" activities easily and quickly. The resulting automated behavioral monitoring system consisted of two main components: 1) a residential system consisting of motion detectors and a base station; and 2) a website that provides for processing of the sensor data converting them to behavioral information displayed with graphics and text for caregivers. [Kutzik, Glascock, 1997; 2000a; 2000b] Figure 1: QuietCareSM ABMS Base Station and Motion Detector 2.1 Residential systemThe wireless motion detectors combine a passive infrared motion detector with a 420 MHz wireless transmitter capable of reliably sending programmable unit identification code for up to 120 feet to the base station. The base station unit collects and transmits sensor data to the remote monitoring site through the Internet. The base stations are comprised of a wireless receiver, a microprocessor and flash memory for data storage, low level processing and Internet upload control, plus a burst modem. The unit is approximately 10 x 6 x 3 inches and is connected to the phone line through a RJ-11 jack and plugged into a standard AC receptacle. The base station firmware is designed to record and time stamp all incoming sensor signals, store them in memory, format them to an XML file and upload periodically to the web server via a burst modem at programmable time intervals. Page 62 To minimize the effects of power and/or phone line failure, the base stations are designed to archive days or even weeks of data and to automatically reboot and upload when power and phone lines are restored. Although there is a standard protocol for detector placement, there is often individual variation depending on the nature of the particular residence into which the system is installed, as well as differences in the behavior of the specific resident, e.g., two storey residence versus one storey, resident sleeping in chair rather than bedroom. The most common configuration of detector placement is: 1) in the bedroom facing the exit-doorway in order to determine wake-up and bedroom activity; 2) inside the bathroom, facing the exit door to determine entry into and activity in the bathroom; 3) outside the bathroom door to sense exiting of the bathroom; 4) either inside the refrigerator or in the kitchen area facing the refrigerator to determine meal activity; and 5) inside a box in which all medication is kept. The decision to place a detector inside or outside of the refrigerator is made based upon the nature of the kitchen, if general activity not associated with meal behavior can be "picked-up" by the kitchen detector; this detector is placed inside the refrigerator. The medication box/detector array is a simple but robust way to determine if an individual has interacted with her/his medication, since the detector registers each time the box is opened. However, the data generated are not specific to any particular medication, but only to the box being opened. Analysis of the data derived from the opening of the box indicates that in approximately 90% of the installations, this information is sufficient to know if an individual is taking her/his medication. In the other 10%, a more sophisticated and expensive "medication" system is required. No such medication dispenser is currently part of the monitoring system, but several such dispensers are available for purchase. Several important conclusions about detector placement were reached over the course of the development of the ABMS. First, detectors need to be placed out of reach of people, especially individuals who use walls to brace themselves when they move about their residences. Early in the development several detectors were dislodged from outside the bathroom by residents knocking them off as they walked down the hall. As mentioned above, if a kitchen is more of a hallway than a separate room, placing the detector on the wall records general activity rather than behavior associated with meal preparation. Placing the detector inside the refrigerator solved this data "confounding" problem. Finally, since the detectors fit into a caddy that is attached to the surface, they can therefore be rotated to face the appropriate direction. However, given the propensity for individuals to rotate the detectors, it was determined that it was best, once located, to permanently attach the detector to the caddy. 2.2 Web-based remote monitoring siteThe web-based remote monitoring site consists of a PIN secured server designed to receive behavioral data from the base units and translate them into information. The server currently used is made up of: the web-based front end for the caregiver and administrators; the SQL based relational database management system; the automated scripts; and the Java based collector software. The server operating system is a Red Hat Linux installation running on Intel hardware. Once in the server, the raw data are translated into information through the application of specific algorithms that take the individual data points corresponding to sensor events and create composite variables representing specific human activities. Page 63 Both status and trend analysis rules are used by the server. Status rules analyze sensor events collected during the same day to infer if a particular human event has occurred. For example, signals from the bathroom motion detector are examined for their time stamp and compared with data from the other motion detectors to determine if a person may have fallen. Trend analysis rules, on the other hand, search for change in the state of the present day's activity in relation to expected frequencies and timings of activities based on a continuous baseline analysis. The information that results from the application of these two rules is further distilled to provide easily interpretable and timely advice to the caregiver. Thus, the web site's PHP pages transform the information on each activity into icons and clear narrative statements that relay the most important trends as simply as possible. Current day information is automatically compared to previously collected activity data in order to determine changes in activity. Green indicators aqre displayed when the data show no significant deviation in the frequency and/or timing of data for a given activity; yellow status indicators are displayed when the frequency and timing of a given activity is higher or lower than expected; and red status indicators are displayed when a still higher threshold of deviation is recorded. Figure 2 is an example of an event summary page. Names used in this figure, as well as in Figure 4 are pseudonyms. Figure 2: Event Summary Page 2.2.1 Determination of alertsThe monitoring system generates two different types of alerts: 1) emergency for wake-up, falls and temperature; and 2) non-emergency for overnight bathroom use, meal preparation and general activity. In the case of emergency alerts, emails are sent at the time the system records the alert regardless of the time of day. Only red alerts are generated for wake-up and falls, whereas for temperature a yellow alert is generated for a predetermined temperature and a red for an even higher or lower temperature. In the case of non-emergency alerts, emails are sent by 10:00 am the day after the status has been determined, e.g., the number of overnight bathroom visits for the previous day were higher or lower than the predetermined threshold. Only yellow alerts are generated for meal preparation, while both yellow and red alerts are generated for overnight bathroom use and general activity. Page 64 On the advice of the medical advisory board, no alerts are sent for medication adherence. However, the number of medication events is recorded and available on the client's website, allowing for changes in medication adherence to be observed and action taken. 2.2.2 Examples of how algorithms generate alertsIn order to show how the monitoring generates alerts, one example each of an emergency and non-emergency alert will be discussed. A fall alert is generated when the inside the bathroom sensor is triggered and the sensor outside the bathroom is not triggered for at least 60 minutes. Once the 60 minute threshold has been passed an emergency alert email is sent to the designated caregiver and the fall indicator on the client's website turns red. The 60 minute threshold can be and has been adjusted to accommodate the specific conditions of particular clients. In one case, the time period was increased to 90 minutes because of the need for the individual to remain in the bathroom for longer periods and reduced to 30 minutes for a second client who was of greater risk of falls. A non-emergency alert for overnight bathroom use is generated when the number of events during a 24 hour period is higher or lower than a threshold based on a sigma value representing a significant deviation from the expected value compared to a 30 day running average of events. In other words, a yellow alert is generated for one sigma value and a red for a second greater sigma value. The actual calculation for the sigma values is proprietary, but the logic is straightforward. 2.2.3 What has been learned about thresholdsThe first thing learned was that the thresholds for overnight bathroom use and meal activity were too sensitive, thus generating, false positive alerts that resulted in caregivers taking needless actions. After consultation with the caregivers, this problem was easily corrected by adjusting the sigma values used for overnight bathroom use and meal activity. The second thing learned was more subtle, in some ways even more important and much more of a challenge to correct than the adjustment of sigma values. Since alert thresholds are based on deviation from an expected value equal to the running average of the number of events for the last 30 days, the thresholds are being continuously adjusted over time. Thus, changes in the number of events for a specific behavior can be of long-term significance, but because the changes are so gradual no alerts may be generated. Using overnight bathroom activity once again, there can be a steady increase in the number of events over a given 30 day period without producing either a single yellow or red alert as the following series of real data points for a monitored individual shows--2, 2, 3, 2, 3, 3, 3, 2, 4, 3, 3, 4, 4, 3, 5, 4, 4, 5, 4, 5, 5, 4, 5, 6, 6, 5, 6, 6, 5, 6. The system is obeying its own rules for alert generation; however the change in the number of events, even though too gradual to generate daily alerts, may be very significant for the well-being of the monitored individual. Hence the conundrum: if the thresholds are set to be sensitive to these gradual changes, too many false positives are generated; however if they are not adjusted, no alerts are generated and potentially serious health problems could be missed. The solution was to develop a sub-routine that charted the average number of actual events per day for each of the behaviors for a designated time period--one week, two weeks, monthly. The sub-routine automatically counts the number of events for each behavior, produces a daily average and creates a multiple time period graph for each behavior. Page 65 Therefore, for the example above, the average for the previous thirty days could be 2.2 while the average for the illustrated 30 days is 4.1. The resulting graph would clearly illustrate the magnitude of the change in the number of bathroom events between the two time periods and as a result, allows for gradual and steady changes in behavior to be observed even when no daily alerts were generated. A further discussion of these trends charts is found in section 4.2 of this article and a much more extensive discussion is found in Glascock and Kutzik, [Glascock and Kutzik, In Press]. 3 Field TestTo test the usability and acceptability of the ABMS, a field test was undertaken in: 1) a high-rise, independent living senior building of one and two bedroom apartments in New York City; and 2) independent households in and around Philadelphia. A special PIN secured website was established for each of the settings that allowed professional staff members and caregivers access to the information on the volunteers on a 24/7 basis. The web pages provided a daily summary for each of the volunteers for six activities: waking time; bathroom falls; the taking of medication; meal preparation, overall level of activity; and nighttime bathroom use. The volunteers were interviewed prior to the installation of the monitoring system to obtain information on demographic background, health status, self assessed functionality, and formal and informal care. In addition, each volunteer was asked to sketch a "typical" day's routine. The characteristics of the volunteers from the two field sites differed in several important ways. Although both populations were predominantly African American (75%) and economically depressed--all but two individuals living in subsidized housing--they differed considerably on average age, 79 for the volunteers at the high-rise, independent living senior building in New York City, 68 for those living in and around Philadelphia, and gender, 80% male in Philadelphia, 80% female in New York. The most important difference between individuals in the two groups was in level of impairment: the volunteers in Philadelphia were much more impaired than those in New York and as a result, 75% of the volunteers in Philadelphia experience impairments that restrict their mobility, whereas only 20% of the volunteers in New York experience such limitations. The field test ran in the New York City residences from October, 2003 until April 2004 while it ran in the residences of the Philadelphia area volunteers from March, 2004 until September, 2004. 3.1 Reliability and ValidityResults from the field test indicate that ABMS is extremely reliable, produces valid information and is accepted by both the volunteers and their caregivers. This is crucial because without a high level of reliability and validity, the system will not meet the needs of the client or the expectations of the caregiver. A large number of "false positives", i.e., indications that an individual did not wake-up, will result in needless worry, disturbing phone calls or even the notification of emergency personnel. Page 66 Just as damaging are "false negatives", i.e., the lack of the recording of an increase in overnight bathroom use, which could indicate a change in health status that needs to be addressed. Consequently, one of the main purposes of the field tests was to determine the overall reliability of the system and validity of the information produced. One of the main objectives of the field test was to assess the reliability of the data generated by ABMS and overall these data were reliable at a 98% level. In order to conclude that ABMS itself operated reliably for a single event the following had to occur: 1) the detector successfully triggered; 2) the signal received by the base station; 3) the data recorded and time stamped; 4) the data uploaded to the website; and 5) the information depicted in the proper format. That is, that the color shown on the chart [see Figure 2] was the result of the system operating reliably. An example of an error is a red showing on the chart for "Bath Fall" when no fall occurred. In this instance something went wrong with the system: either the bathroom sensor recorded the participant's entry into the bathroom, but not her exit; or the signal did not reach the receiver; or the signal was not uploaded to the website. Over 12,500 such "events" were included in the analysis and the overall reliability of the monitoring system was slightly over 98%. A second even more rigorous test of reliability was employed in which every recorded "event" for each day was examined to determine if there were inconsistencies, that is, if an event was recorded, e.g., medication taken, when the detailed activity chart indicated that there was no activity in the residence. If the crosscheck showed such a contradiction, an error in the reliability of ABMS occurred. This examination resulted in more than 47,000 data points being cross checked and a reliability level of slightly less than 98%. An attempt was made to determine the cause for the errors found in both of the tests of reliability. The most frequent reasons in the first test, accounting for 90% of the errors, was: 1) faulty sensor placement, e.g., placing a motion detector within the refrigerator to register each time the refrigerator door was opened and closed did not work well resulting in intermittent signals being received; and 2) human tampering, e.g., a volunteer removing a motion detector from the wall because she did not think that it was working. The most common cause of errors in the second test of reliability was the appearance of activity, specifically meal preparation, when no general activity was recorded. These findings resulted in a series of small changes being made in the way the system was installed and adjustments in several of the algorithms that were used in the timing of general activity. First, more care was taken during installation to discuss the need for residents not to move the location of the motion detector or remove it from the wall, even if it appeared to be malfunctioning. In addition, new detectors that actually report when they are malfunctioning have been incorporated into the system. Secondly, it was decided to use a stronger adhesive to attach the motion detectors to the wall and, in many cases, to actually tape the detectors to their brackets so that they could not be moved around. These two changes eliminated most, if not all, of the reliability issues associated with human tampering. As for the reliability problems associated with specific behavior being reported without them being logged in the general activity area, an adjustment to the algorithm that logged the various activities corrected this aberration. In contrast to the determination of reliability, it is more difficult to present a precise level of validity of the information produced. This is because of the nature of validity itself and the introduction of human interpretation into the calculations. Page 67 In the context of our test, validity is regarded as the truthfulness of the information produced by the monitoring system, that is, that the system truly measures the selected activities. The system may be highly reliable, but the information is only valid if it can be correctly interpreted; that a red actually means that something is wrong. To aid in our analysis, we have divided validity into two components: machine validity and caregiver validity. Machine validity is a combination of the system's reliability and the validity of the interpretive algorithms that determine the patterns of behavior of the participants and continuously look for change in the patterns. Thus, the colors displayed on the event chart [Figure 2] are entirely the result of the monitoring system's hardware and software functioning properly. It is reasonable to argue that underlying this functioning is a set of assumptions about the selected activities, e.g., the opening and closing of the refrigerator is a valid "proxy" measure for meal preparation, but once these assumptions have been programmed into the system, it is relatively easy to determine the level of machine validity. This level is 95%. Since, as stated above, the system's reliability is a determinant of machine validity, it is, by logic, impossible for machine validity to be greater than the systems reliability (98%); therefore, the remaining errors must be the result of problems with the algorithms used to produce the color indicators. All but a tiny number of these errors are "threshold errors", e.g., the color indicator showing red for meal preparation because of a decline in "events" from 22 the preceding day to 14. The algorithm that calculated the running average was placing too much weight on the 22 events and not enough on the overall pattern, thus resulting in the threshold for red to be crossed when it should not have been. As a result, over 90% of the machine validity errors were easily corrected by an adjustment in the appropriate algorithm. Caregiver validity is not as easily calculated and yet, it is the reason for the entire monitoring system to be developed. People, who are making decisions based upon the "advice" that the system produces, must have confidence that what they see is valid, or they will not take action. If a caregiver is not completely confident that a red truly means that an action must be taken, the system has little utility. The need to assess caregiver validity led to a Pilot Study that focused on the way the ABMS was actually employed in caregiving. 4 Pilot StudyA twelve month pilot study to evaluate the effectiveness of ABMS in a comprehensive care management program began May 1, 2004. This study was undertaken in conjunction with Keystone Home Health Services, Inc./Keystone Hospice (Keystone) of Wyndmoor, Pennsylvania and Living Independently Group Inc. (LIG) of New York City. Keystone provided access to their clients and the participation of several of its visiting nurses, while LIG allowed the use of QuietCaresm, their commercialized product based on the ABMS. The goal of the pilot study was to have systems operating in the homes of twenty individuals with chronic health care problems for twelve consecutive months. However, this has proven to be difficult because of a higher attrition rate than originally anticipated. Although QuietCaresm has been installed in the residences of a total of twenty-six Keystone clients, currently the system is operating in only seventeen. Page 68 Three of the original clients have died, another three have had to enter institutions because of greater care needs and Keystone has discontinued services to another three. In addition, three of the clients still in the pilot study have spent periods of two to five weeks in the hospital, while another two have been unable to pay their phone bills for at least one month. The result of this is that the system has not been running consecutively in any of these five residences. This higher than expected attrition rate is the result of the seriousness of the health problems of the clients and their economic status. Each of the clients, regardless of age, have a multitude of health problems, including among others, congestive heart failure, emphysema, HIV, Parkinson's, Alzheimer's, diabetes, cancer and LUPUS. In addition, the level of poverty experienced by many of the clients in the study has not only been a contributing factor in their overall health, but also in their ability to maintain an operating phone, that is essential for the operation of the monitoring system. Thus, new clients have been added as others have been removed and the duration of the pilot study has been extended to eighteen months. In this way, it is hoped that a total of twenty clients will have the system in their homes for twelve months; it's just that they will not be the original twenty clients. The characteristics of the twenty-six clients who have been, for any length of time, participants in the pilot study are as follows: seventeen are male and nine are female; seventeen are African-American, seven Caucasian, one Hispanic and one Asian-American; the average age is 57, with six clients over the age of 65; all but two are economically disadvantaged; and all but one lives in the city of Philadelphia. 4.1 The Caregiving PyramidThe challenge associated with the introduction of any new caregiving practice, let alone one dependent on the use of an innovative technology, is how to engage practitioners and clients to use it. Even if practitioners are willing to try to use it, and clients willing to have it in their homes, an equally daunting challenge is to incorporate the new technology into existing caregiving practice models. Professional caregivers often fear that they will be replaced by a machine and/or dread appearing dim-witted because they are unfamiliar with the technology. Clients, on the other hand, are often fearful of new people and machines entering their homes, especially machines that "report" on their behavior. Thus, it is imperative that the caregivers, as well as the clients who have QuietCaresm in their homes, understand the role played by behavioral monitoring in a comprehensive care program. This role was outlined in the introduction of this paper: to obtain clearer and more accurate knowledge of a person's performance of functional tasks in their home environment. This is all that ABMS does; it just does it more reliably, with a greater level of validity and in a timelier manner than other such methods. In order to explain how this is accomplished within the pilot study, it is necessary to understand how data and information are used in caregiving. Page 69
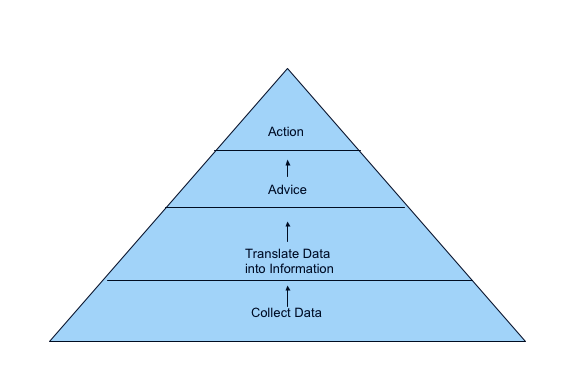
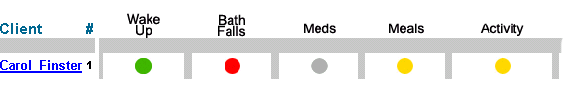
Figure 3: Caregiving Pyramid The above figure depicts a general caregiving model that begins, at level one, with the collection of data on a client. In this context, these data are about functional tasks, e.g., overnight toileting, medication adherence. As discussed in the Introduction, in existing caregiving models, these data are most often collected by various forms of retrospective interviewing, supplemented by pill counting or questioning a caregiver about the client's behavior. The reliability of these data is always a concern because of timeliness and the accuracy of responses. If the data are unreliable, the information that results, level two of the pyramid, will not be valid. Validity entails the human interpretation of the data and, in a caregiving context, is usually the result of some protocol combined with experience. In other words, the data, whether reliable or not, are subject to interpretation that translates the data into information. An example of invalid information is an alarm generated by a personal emergency response system indicating that there is a fall when no fall has occurred. This is a false positive and is both expensive and dangerous, given that frequent such false positives could result in the assumption that there is no emergency and thus lack of response. However, all information, in a caregiving context, is ultimately distilled into some form of advice-level three on the pyramid. This advice may be quite specific, as illustrated in the fall example above, a client has fallen, or more general, medication needs to be reviewed with the client because there are too many pills left at the end of the month. Whether general or specific the advice leads directly to action, level four, by the caregiver-phone 911, speak to client about medication adherence. The action is taken because the caregiver is confident in the advice, the advice is regarded as accurate because the information on which it is based is valid, and the information is valid because the data are reliable. Thus, we have come full circle. If the data are not reliable, the base of the pyramid, the action taken by the caregiver may not be appropriate or the timing may be inappropriate or the caregiver taking the action may not be the most appropriate person for the required action. ABMS was designed to collect more reliable data and to more effectively and efficiently translate the data into valid information than other data gathering techniques. The field test, reported upon above, has demonstrated that the system collects extremely reliable functional data (98% level of reliability) that compares favorably with data collected by any other caregiving model. Page 70 In addition, the data are much timelier, being collected and analyzed continuously compared to the infrequent data gathering devices employed in other caregiving models. Moreover, the resulting information has an extremely high validity (95%) and an undeniable advantage over the information collected by any other caregiving model. The information generated is continuously interpreted, both on a daily basis and through trend analysis, to pinpoint changes in behavior that could indicate a problem before it can become a crisis. The key, of course, is how this information is distilled into advice and then action taken by the caregiver. 4.2 Alerts and TrendsQuietCaresm provides two types of information for caregivers: 1) alerts; and 2) trends. The alerts, as discussed previously, are either red or yellow and "alert" the caregiver to a significant change in one or more of the monitored activities, e.g., decrease in meal activity, increase in overnight bathroom use, or that a fall has occurred. In the pilot study, the visiting nurses received emails indicating an alert and through this email they had access to the client's specific website so that they could check other activities. Trends, on the other hand, are the result of the analysis of data over a much longer period of time. In the pilot study, a monthly average was generated for each of the activities monitored: a client could average 3.5 overnight bathroom visits, 22.25 meal activites, and 2.3 medication events, for example, per day, for the month of July. These monthly figures could then be "plotted" for several months so that trends could be discerned. Figure 4 is an example of an alert received by a visiting nurse during the pilot study. The red disk indicates that a fall has occurred while the two yellows specify that there has been a significant decline in the number of meal events and overall activity during the previous 24 hours. The caregiver can and did receive more detailed information about these activities, time of the fall, actual number of meal events and level of activity, by clicking on the colored disk. Figure 4: Alert Line Thus, alerts notify a caregiver as to significant changes in the activity level of the client during the previous 24 hours and thus, allow for action to be taken to address the indicated problem almost immediately. Trends, since they are based on the analysis of data from a much longer period of time, allow for more subtle changes in behavior to be observed. These are the type of gradual and slight changes that are difficult, if not impossible, for the individual themselves to notice or even for a caregiver to discern. Retrospective interviewing as to changes in the level of activities over the last month, six months, year, even by a well meaning and dedicated caregiver, is fraught with difficulty and the results with uncertainty. QuietCaresm, on the other hand, provides objective data that is translated into timely and accurate information and then charted to provide clear and easily deciphered trend summaries. Page 71 Figure 5 shows a steady decline in meal activity over a six month period for an elderly African American woman. Even though only a few meal alerts (7 in over 180 days) were generated during this six month period because the day-to-day changes were too slight to register as significant and thus to generate an alert, Figure 5 clearly shows a steady decline in meal activity from an average of 23.2 in May to 8.3 in September. As it turns out, the decline in meal activity confirmed the overall impression by the visiting nurse and client's physician of decline and the client was moved to an assisted living facility at the end of September. Figure 5: Trend Chart 4.3 Case StudiesThe following seven case studies are drawn from the over one hundred times that the visiting nurses have used an email, an alert, the website and/or monthly trend chart to alter the care provided for twenty-two of the twenty-six clients (85%) with QuietCaresm in their residences. All but two of these twenty-two clients have had their care altered more than once, with three of these clients having their care altered over ten times each. The phrase "alter the care" actually entails one of nine actions that can be triggered by information produced by the system: 1) increase in the frequency of home visits by nurse; 2) reduction in the frequency of home visits by nurse; 3) unscheduled phone call; 4) unscheduled home visit; 5) adjustment in care plan, e.g., medication counseling; 6) bringing to the attention of other care providers that needs of client had changed; 7) immediate response, e.g., absence indicated, fall alert; 8) increased level of care outside of residence, e.g., hospitalization, other institutionalization; and 9) non-medical/clinical action, e.g., home health aide not at residence, air conditioner repair. Thus, each alteration of care is actually an episode comprising three distinct parts: the trigger-an email, alert, monthly trend chart; the action-an unscheduled phone call, an immediate response; and an outcome-medication counseling, adjustment of nurse's schedule, hospitalization. Page 72 Some of these episodes have only a single action and a single outcome, i.e., an unscheduled phone call that results in the nurse being reassured that the client is stable and that no other action is required, while others involve multiple actions and multiple outcomes, i.e., an unscheduled phone call, resulting in an unscheduled visit, resulting in notifying other care providers that the client's needs have changed, leading to hospitalization. 4.3.1 Case Study 1The first case study describes a single episode in which the visiting nurse received a red alert email indicating a dramatic increase in overnight bathroom use (three times normal) for a 48 year old African-American male suffering from renal failure. The nurse, following the Keystone/QuietCaresm protocol, made an unscheduled phone call to the client to inquire as to the reasons for this spike in overnight bathroom use. The client told the nurse that he had been up all night treating a bad case of hives and that he had been in and out of the bathroom several times. Since the client also suffered from HIV and thus, the hives could lead to a serious infection, the visiting nurse phoned the client's physician to discuss possible treatment options. Once a decision had been made as to the best treatment, the nurse once again phoned the client with the information and instructions as to how to obtain the medication and how to use it. The following day the visiting nurse called-up the client's webpage and was reassured that the client had returned to his normal overnight bathroom use pattern indicating that the treatment for the hives had been effective. 4.3.2 Case Study 2The second case study also describes a single episode, but this time the visiting nurse received a red alert email indicating that there had been a dramatic decline in general activity over the last 24 hours of a 67 year old African-American male suffering from congestive heart disease. The nurse quickly checked the client's website and determined that there had been no activity recorded since early the previous evening. Once again, following the Keystone/QuietCaresm protocol, the nurse made an unscheduled phone call to the client. When the client did not answer the phone, the nurse made an unscheduled visit to the residence of the client, where he discovered that the client was unconscious. The nurse notified the appropriate emergency service and the client was immediately taken to the hospital for treatment of the heart attack he had suffered. 4.3.3 Case Study 3The third case study, although describing a single episode, is carried out over several days and shows how behavioral monitoring, in addition to indicating the need to immediately respond to an emergency situation, can be used to track changes over a period of time. In this case the, visiting nurse received yellow alert emails indicating that for two straight days a 43 year old Caucasian male suffering from metastatic cancer of the bladder and bowel had only one-half of his normal meal events-from an average of over eight per day to only four events. In addition, on the second day, for the first time in two weeks, the client had not taken his medication. The nurse, following protocol, made an unscheduled phone call to the client to determine his status, the client stated that he felt bad, but didn't think that it was necessary for the nurse to make an unscheduled visit. Page 73 However, the next morning the nurse received two yellow alerts for this client: one indicating that meal activity had declined to only two events; and the second indicating that the client's activity level had declined to only 34% of normal. These alerts, combined with the fact that for the second straight day the client had not taken his medication, resulted in an unscheduled phone call to the client followed by an unscheduled visit at which time the nurse determined that the client, who had been vomiting and experiencing diarrhoea for the previous three days, needed to be hospitalized. 4.3.4 Case Study 4The fourth case study consists of two closely related episodes concerning a 73 year old Caucasian female suffering from Parkinson's disease and hypotension. The visiting nurse received an email red alert indicating a client had a fall and yellow alerts for meal activity that had declined from eleven the previous day to three on the day in question and general activity that was only 23% of normal on the given day. The nurse made an unscheduled phone call to the client and when she did not answer the phone the nurse immediately went to her house. She had had a fall, had made it to her bed, but was disoriented and in pain. She was admitted to the hospital. Tellingly, the client was wearing a pendant that was part of a personal emergency response system when she had her fall. When the visiting nurse asked her why she hadn't pushed the button on the pendant, she replied "I didn't want to bother anybody. I was able to get back to bed, so I thought I was ok". Less than three weeks after the client had been discharged from the hospital, the visiting nurse received a red alert email indicating, once more, that the elderly client had had another fall while making a trip to the commode at approximately 10:30 pm. Again, the nurse made an unscheduled phone call, followed by an unscheduled visit to the client. Although she was well enough to remain in her own residence, given her frail condition, the nurse brought her condition to the attention of her physician and began to check the client's web page daily, even if no email alerts were received. When the client had another fall three weeks later at almost the same time of night, the nurse once again made an unscheduled phone call followed by an unscheduled visit with the result being that this time she was admitted to the hospital. After reviewing her case with her physician, it was determined that the client was taking her pain medication too close to bedtime with the result being that when she got out of bed to use the commode, she was woozy and subject to falling. Given that the client made a trip to the commode almost every night between 10:00 pm and 11:00 pm, the physician recommended that she take the pain medication earlier in the evening which would reduce the possibility of her being woozy and falling. Since this suggestion was made, the client has not fallen. 4.3.5 Case Study 5Less than two weeks after a 54 year old Hispanic male client returned from the hospital, the visiting nurse received an email red alert indicating the client had two falls during the night. The nurse made an unscheduled phone call to the client who appeared confused on the phone. The nurse made an unscheduled visit during which the client denied having a fall and reported that he had felt bad and was constipated so he had spent "long" periods in the bathroom which, because these events were over an hour in duration, QuietCaresm interpreted as "falls". Page 74 Even though the nurse recommended an over-the-counter remedy for the client's constipation, over the next eight days, a total of nine red alert fall emails were received and each day the nurse phoned the client who stated that he had not fallen. During this same period, the nurse received four yellow and one red email alerts indicating increased overnight bathroom activity. The nurse phoned the client on each of these days and made unscheduled visits on three of the days. The client's overall decline, as reflected in the fall alerts, increased overnight bathroom use and confused state-of-mind resulted in the client being moved into a hospice facility. 4.3.6 Case Study 6In the sixth case study, the visiting nurse received a red alert email that there had been no wake-up for a 49 year old Caucasian female client suffering from LUPUS, severe depression and moderate dementia. Checking the client's web-site, the nurse determined that there had not been any general activity overnight which for this client was extremely unusual since she had a consistent pattern of disturbed sleep that was indicated by frequent overnight activity. When an unscheduled phone call to the client's residence was not answered, relatives were notified. Fearing that the client had had a fall or was in some other way incapacitated, a relative went to the residence and found that the client was not there. It turns out that the client had made an unplanned visit to her daughter who lived out of town and thus, the client was not at risk. However, the nurse, client and relative all expressed relief that the nurse had been alerted to the client's absence and that the Keystone/QuietCaresm protocol had been followed and someone had been sent to check on her well-being. 4.3.7 Case Study 7Over a seven day period, the nurse received four email alerts concerning medication adherence for a 51 year old African American male with heart disease, hypertension and renal failure. A review of the client's web page showed a dramatic fluctuation in the number of times each day the client took his medication, some days the client did not take his medication at all and on other days it appeared as if he was taking it six or seven times a day. Based on this information, the nurse increased his home visits from once a week to twice a week and began to personally fill the client's medication dispenser. These changes, when accompanied by discussions on the importance of following the prescribed medication regime, resulted in the client's medication adherence becoming consistent and, over time, to an actual reduction in the frequency of home visits by the nurse to once every two weeks. 4.3.8 Case Study SummaryIn each of the above case studies, the system provided information on the status of the individual client that was then used by the care provider to take an appropriate action. These actions ranged from unscheduled phone calls to check the client's status, to adjustments in the client's care plan, to immediate responses resulting in hospitalization. However, in each case, the care provider responded based on their confidence that the emails they received, confirmed by the information on the client's web pages, indicated that a change in activity had occurred that put the client at risk. Page 75 That is, that the data collected, level one of the pyramid, was reliable, that, in turn, this information received by email or viewed on the web page was valid, level two, advice found in the protocol was appropriate, level three, and the action necessary, level four. The result of the action, in each and every one of the case studies was that the client received more appropriate and timely care and thus, had greater well-being. 5 ConclusionThe case studies illustrate the means by which smart-home technology, health telematics and the Internet can be used for the assessment of the functional abilities of individuals in their own homes within the community. Instead of the frail individual having to visit a health care facility or a caregiver having to make repeated visits to the residence, QuietCaresm continuously collected and interpreted the clients' activities of daily living. This information is then used by the caregiver to alter care and respond to emergency conditions. The case studies make clear that the clients received and continue to receive better care and, as a result, are able to retain more independence while at the same time, have a greater sense of well-being. The following three statements exemplify the feelings that many of the clients have about the ABMS and the way that it helps provide care to them: Just knowing that someone knows if I am in trouble makes me feel safer. I have several friends who really need the system too. (elderly female client) This is a great idea. It's really like a friend who checks on you each day. When I was really sick once, I didn't do what I normally do, but it took several days before a friend of mine noticed that I wasn't at group. Then she checked on me. No one in the apartments even noticed that I wasn't around. Now, I know that someone is checking on me daily. This is great. (female client) It's like someone out there looking after me, making sure that everything is OK. Since I have lost most of my equilibrium because of my problem with my hearing, I am really worried about falling. This way, Tim can check on me to see that I have fallen or am not able to move about. (male client with Meniere's disease) Additionally, the visiting nurses who are using the system to help them provide care to their clients also have favorable opinions: Since I make a phone call to at least one of my clients using the system daily, I feel much better about the level of care I am delivering because I have a specific issue that I can address, rather than just 'how are you doing'. Page 76 I believe that my relationships with my clients who have the system have become closer. They feel more connected to me and to the treatment they receive from me. Thus, QuietCaresm allows for more appropriate care to be provided by more appropriate caregivers in a timelier manner than other care provision models, because it focuses on specific task oriented behaviors. However, behavioral monitoring alone provides only part of the total care package that frail individuals require if they are to remain in their residences. It is apparent that many of these individuals also require services that can best be provided by telemedicine and additional environmental and security functions most often found today in smart-home applications. Consequently it appears logical that behavioral monitoring, telemedicine and certain environmental and security functions be integrated or bundled into a much more comprehensive system. The first steps in this bundling have taken place as part of the pilot study discussed above. The recording of ambient temperature is now part of the QuietCare system and red and yellow alerts are sent to the visiting nurse if the temperature in a client's residence is too high or too low. In at least two instances, the nurse has responded when the temperature was dangerously high and in both cases, repairs were made to air conditioners on behalf of the client. Plans have been made for additional environment and security features to be added to the QuietCaresm system including sensors that indicate when the front door is opened, smoke detectors and a stove monitoring device. Commercially available telemedicine features are being also bundled with the system. These include: a blood pressure cuff; a digital scale for recording and monitoring a client's weight; a blood sugar monitor for diabetics; and sophisticated medication dispensers. Finally, a personal emergency response system (PERS) is being included to provide an additional level of security. The plan is to integrate these various components into a single bundled system that could be used as easily and effectively as the current iteration of QuietCaresm. Once this new system is functional its testing will necessitate a larger and more comprehensive demonstration project than the currently on-going pilot study. However, the same measures will be employed to evaluate the bundled system that are being used in the pilot study. In other words, is the system able to provide better care, to a larger number of individuals living in their own residences in a cost-effective way, than existing care provision models? If the bundled system can achieve these objectives, then the full potential of health telematics, and in particular pervasive computing technology, will have been met. Acknowledgements We want to thank John Lakian and George Boyajian, Ph.D. of Living Independently Group, Inc, New York City, for the material presented in Photograph 1 and Figure 1. In addition, we want to thank our partners in the field test and pilot study at Keystone Home Health Services, Inc./Keystone Hospice in Philadelphia and Phelps Home Residence at Goddard-Riverside Settlement in New York City. In particular, we thank Gail Inderwies, Louise Taft, Michael John and Tom Salber from Keystone and Doris Colon at Goddard for their participation in the project and their many contributions to our understanding of comprehensive care management. Page 77 References[Alyfuku, Hiruta, 1994] K. Alyfuku, Y. Hiruta: "Networked Health Care and Monitoring System"; United States Patent # 5,410,471, United States Patent Office, Washington, DC, USA, 1994. [Chan, Campo, Esteve, 2004] M. Chan, E. Campo, D. Esteve: "Monitoring Elderly People Using a Multisensor System"; Toward a Human-Friendly Assistive Environment. D. Zhang, M. Mokhtari, editors, Assistive Technology Research Series 14, IOS Press, Amsterdam, The Netherlands 2004, pp. 162-170. [Fillenbaum, 2001] G. Fillenbaum: "Multidimensional Functional Assessment: Overview"; The Encyclopedia of Elder Care, M. D. Mezey, editor-in-chief, Springer, New York, USA 2001, pp. 438-440. [Giroux, Guertin, 2004] S. Giroux, S. Guertin: "A Pervasive Reminder System for Smart Homes"; Toward a Human-Friendly Assistive Environment. D. Zhang, M. Mokhtari, editors, Assistive Technology Research Series 14, IOS Press, Amsterdam, The Netherlands 2004, pp. 98-106. [Glascock, Kutzik, 2004] A. P. Glascock, D. Kutzik: "Moving Telematics from the Laboratory to a Truly Enabling Technology within the Community"; Toward a Human-Friendly Assistive Environment. D. Zhang, M. Mokhtari, editors, Assistive Technology Research Series 14, IOS Press, Amsterdam, The Netherlands 2004, pp. 145-154. [Glascock, Kutzik, In Press] A.P. Glascock, D. Kutzik: "Automated Behavioral Monitoring." In Smart Homes and User Values, edited by U. Keijer and G. Sandstrom. Eastern Mediterranean University, Faculty of Architecture, Gazimagusa, Mersin, Turkey, In Press. [Himanen, 2004] M. Himanen: "Potential for Smart Home Technology"; Toward a Human-Friendly Assistive Environment. D. Zhang, M. Mokhtari, editors, Assistive Technology Research Series 14, IOS Press, Amsterdam, The Netherlands 2004, pp. 67-78. [Kane, Kane, 1981] R. A. Kane, R. L Kane: "Assessing the Elderly: A Practical Guide to Measurement"; Lexington Books, Lexington, MA, USA 1981, pp. 25-67. [Kutzik, Glascock, 1997] D. Kutzik, A. P. Glascock: "System for Generating Periodic Reports, Generating Trend Analysis, and Intervention in Accordance with Trend Analysis from a Detection Subsystem for Monitoring Daily Living Activity"; United States Patent #5,692,215. United States Patent Office, Washington, DC, USA, 1997. [Kutzik, Glascock, 2000a] D. Kutzik, A. P. Glascock: "User Monitoring System"; Canadian Patent #2,208,594. Canadian Patent and Intellectual Property Office, Ottawa-Hull, Canada, 2000. Page 78 [Kutzik, Glascock, 2000b] D. Kutzik, A. P. Glascock: "System for Generating Periodic Reports, Generating Trend Analysis, and Intervention in Accordance with Trend Analysis from a Detection Subsystem for Monitoring Daily Living Activity-2"; United States Patent #6,108,685. United States Patent Office, Washington, DC, USA, 2000. [Kutzik, Glascock, 2004] D. Kutzik, A. P. Glascock: "Monitoring Houshold Behavior to Enhance Safety and Well-Being." In Gerotechnology: Research and Practice in Technology and Aging, David Burdick and Sunkyo Kwon, editors, Springer Publishing Company, New York, NY, pp. 132-144. [Lawton, 1988] M. P. Lawton: "Scales to Measure Competence in Everyday Activities"; Psychopharmacological Bulletin, 24 1988, pp. 609-614. [Togawa, 1992] T. Togawa: "Physiological Monitoring Techniques for Home Health Care"; Biomedical Sciences and Instrumentation, 28 1992, pp. 105-110. [Wade, Collin, 1988] D. T. Wade, C. Collin: "The Barthel ADL Index: a Standard Measure of Physical Disability?"; International Disability Studies, 10 1988, pp. 64-67. Page 79 |
|||||||||||||||||